This report was recently updated on April 14 2025 with the latest and most recent
market numbers
Global Bio-LNG Market Size, Trends & Analysis - Forecasts to 2029 By Source Type (Organic Household Waste, Organic Industrial Waste, and Municipal Waste), By Application (Transportation Fuel, Power Generation, and Others), and By Region (North America, Asia Pacific, Central and South America, Europe, and Middle East and Africa), Competitive Landscape, Company Market Share Analysis, and End User Analysis
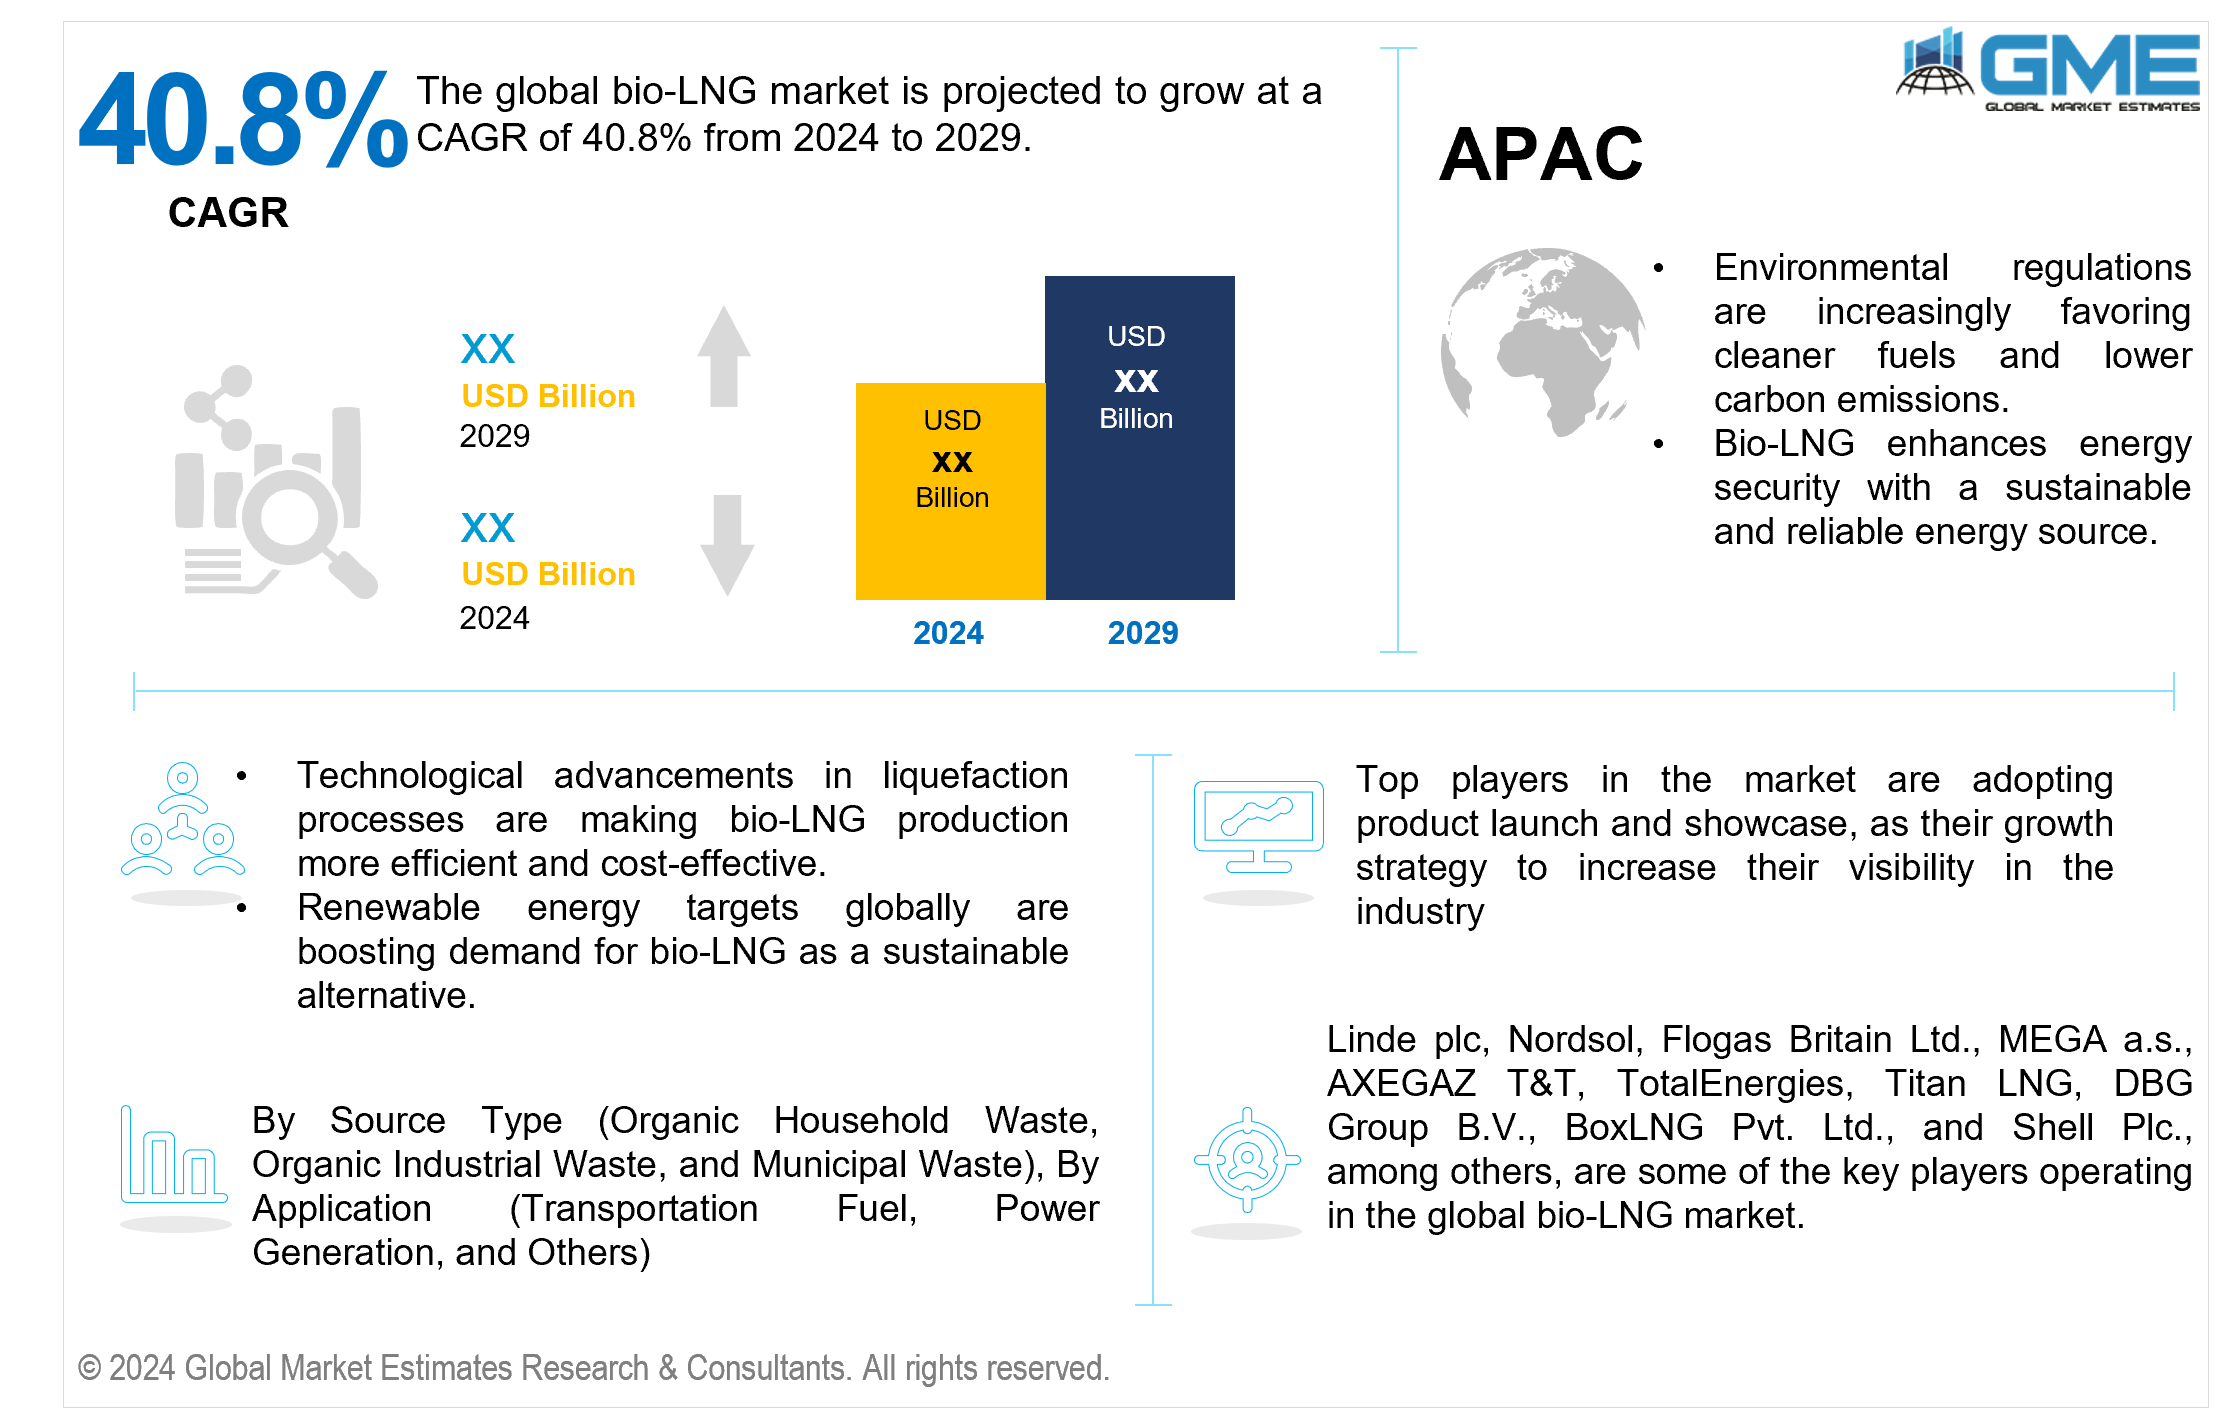
The global bio-LNG market is projected to grow at a CAGR of 40.8% from 2024 to 2029.
The bio-LNG market is primarily driven by rigorous environmental rules and policies aimed at lowering greenhouse gas emissions. Governments worldwide are introducing carbon pricing, providing renewable energy subsidies, and enforcing higher emission limits to encourage bio-LNG use. For instance, in the U.S., a significant number of operational RNG projects are leveraging abundant sources like landfill gas and agricultural waste. The United States alone has seen substantial growth in RNG production, supported by initiatives like the EPA's LMOP and AgSTAR programs.
Furthermore, several governments have established high renewable energy targets as part of their climate action plans, with bio-LNG playing a critical role in reaching these objectives, particularly in areas where electrification is less viable. For instance, India has set a goal of reducing the nation's carbon intensity by less than 45% by the end of the decade, installing 50% renewable electricity by 2030, and reaching net-zero carbon emissions by 2070.
Biogas purification and liquefaction procedures have improved in efficiency and cost, due to technological improvements. Improved storage and transportation infrastructure helps to drive industry expansion. The emphasis on sustainable waste management techniques also helps tremendously, as biogas produced from organic waste may be converted to Bio LNG, addressing both waste reduction and renewable energy production. Bio LNG is an appealing solution for both waste management and energy generation due to its dual benefits.
Moreover, increased demand for clean fuels in the transportation and industrial sectors is a major driver. Bio LNG has a reduced carbon impact compared to traditional fossil fuels, which aligns with business sustainability efforts and ESG strategies. Economic incentives such as tax credits, grants, and subsidies also help to offset the early costs of bio LNG infrastructure, encouraging more investment. Combined with rising consumer awareness and demand for sustainable energy, these factors contribute to the bio LNG market's growth as a significant component of the global energy transition.
One key restraint in the bio LNG market is the large initial investment necessary for production facilities and infrastructure. This includes the price of biogas purification, liquefaction technology, and transportation networks, which might be a barrier to broader adoption, especially in underdeveloped countries with limited financial resources.
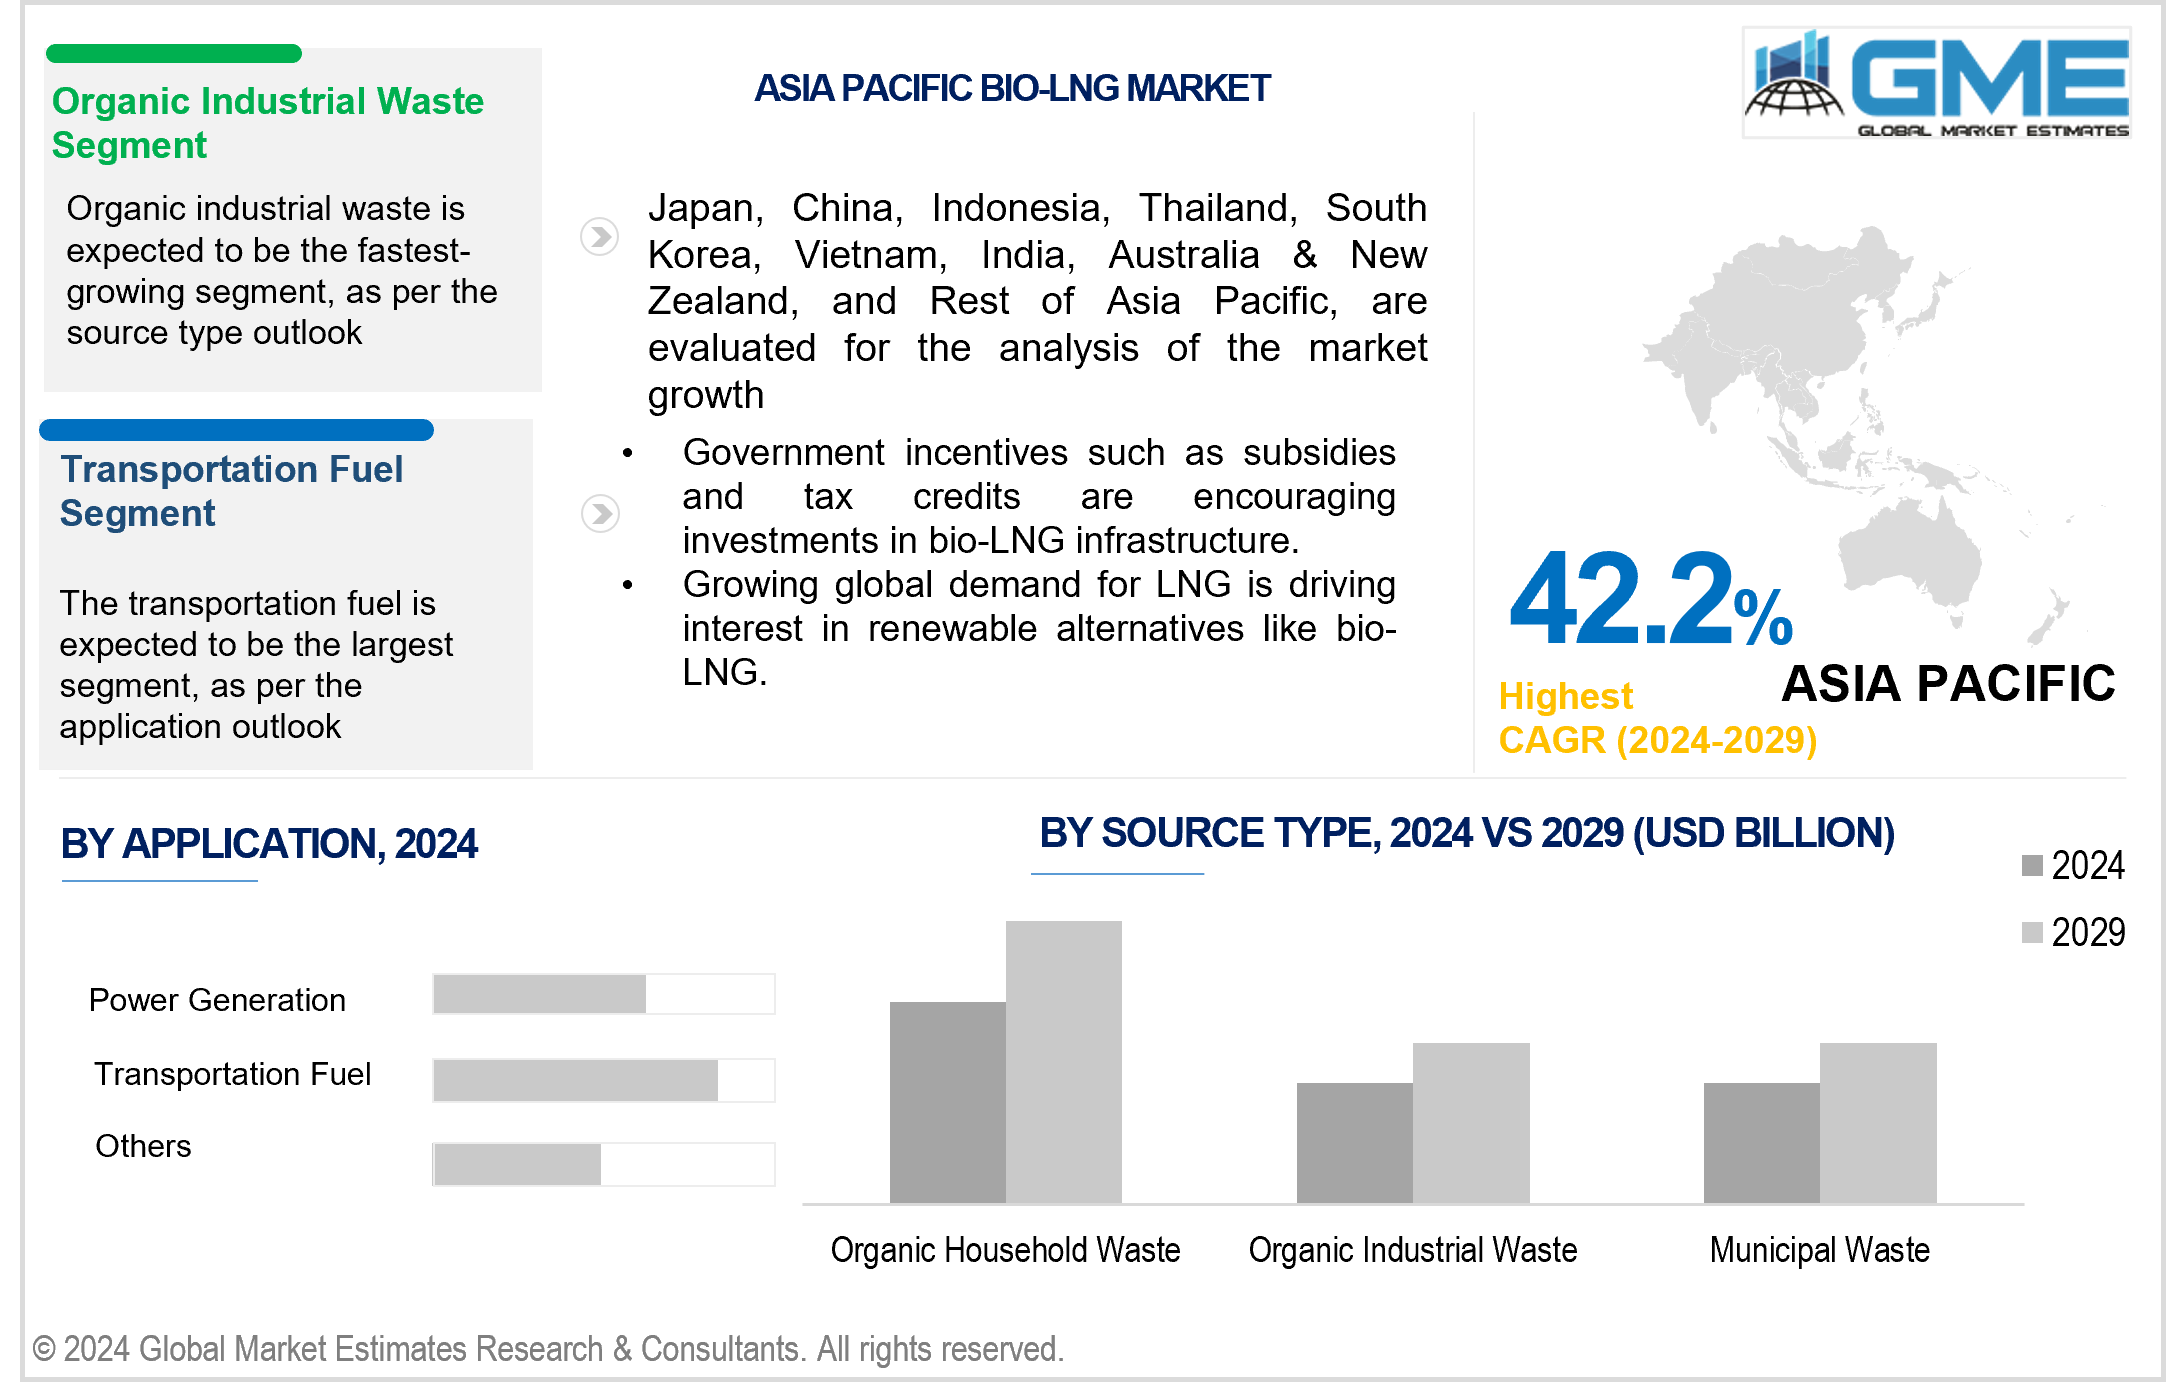
The transportation fuel segment is expected to hold the largest share of the market. The segment's growth is owing to rising demand for cleaner alternatives to diesel and gasoline in heavy-duty and long-haul vehicles. Bio LNG's high energy density, low emissions, and compliance with severe environmental requirements make it an appealing and sustainable solution for the transportation industry.
The power generation segment is expected to be the fastest-growing segment in the market from 2024 to 2029. The growth is due to the rising need for dependable, clean energy sources. Bio LNG is a sustainable alternative to coal and other fossil fuels, helping to cater to renewable energy targets and reduce carbon emissions. Advances in technology and infrastructure, together with supporting government regulations, have accelerated its implementation in power generation.
The organic industrial waste segment is anticipated to be the fastest-growing segment in the market from 2024 to 2029. Industrial activities create large amounts of organic waste that can be easily converted into biogas, providing a consistent and sustainable feedstock for bio-LNG production. Increasing regulatory pressure on industry to manage and minimize organic waste, along with developments in waste-to-energy technology, is accelerating the use of organic industrial waste as a source for bio-LNG. This area enables enterprises to enhance waste management methods while also contributing to their renewable energy ambitions.
The organic household waste segment is expected to hold the largest share of the market. The expected growth of the segment is due to the abundance of organic waste from houses, which provides a consistent and sustainable feedstock for biogas production. Using household garbage for bio-LNG production improves waste management, decreases landfill use, and promotes a circular economy, making it a highly sustainable and economically feasible source of bio LNG.
Europe is expected to be the largest region in the global market. The primary reasons boosting the market growth in this region include rigorous environmental rules that encourage the use of renewable fuels in transportation sectors such as heavy-duty vehicles and maritime transport. The region's current LNG infrastructure lays a solid platform for increasing Bio-LNG production. Furthermore, favorable legislation and increased investments in bioenergy add to Europe's importance. Europe hosted 1,322 biomethane-producing facilities by April 2023. This growth aligns with EU targets, including a 75% reduction in GHG emissions from maritime transport by 2050.
Asia Pacific is predicted to witness rapid growth during the forecast period. The regional market growth is attributed to increasing urbanization, industrialization, and government measures to minimize air pollution and dependency on fossil fuels. Countries in the Asia Pacific region, including China, India, and Japan, are investing in renewable energy infrastructure, such as Bio LNG, to fulfill rising energy demand in a sustainable manner. Favorable legislative frameworks and growing awareness of environmental sustainability drive market expansion in the Asia Pacific.
Linde plc, Nordsol, Flogas Britain Ltd., MEGA a.s., AXEGAZ T&T, TotalEnergies, Titan LNG, DBG Group B.V., BoxLNG Pvt. Ltd., and Shell Plc., among others, are some of the key players operating in the global bio-LNG market.
Please note: This is not an exhaustive list of companies profiled in the report.
In May 2024, Nordsol and Prodeval announced plans to collaborate on constructing a cutting-edge bio-LNG production facility in Southern Portugal, scheduled to begin operations in early 2025. This facility will utilize organic waste from the olive oil production sector to produce bio-LNG and biogenic CO2.
In April 2024, Shell Energy inaugurated its first bio-LNG plant in Germany, located at the Cologne-Godorf refinery site after two years of construction. With a production capacity of 100,000 tonnes per year, it is Germany's largest facility. This plant aims to fuel 4,000 to 5,000 LNG trucks annually, significantly contributing to reducing carbon emissions in transportation.
1 STRATEGIC INSIGHTS ON NEW REVENUE POCKETS
1.1 Strategic Opportunity & Attractiveness Analysis
1.1.1 Hot Revenue Pockets
1.1.2 Market Attractiveness Score
1.1.3 Revenue Impacting Opportunity
1.1.4 High Growing Region/Country
1.1.5 Competitor Analysis
1.1.6 Consumer Analysis
1.2 Global Market Estimates' View
1.3 Strategic Insights across Business Functions
1.3.1 For Chief Executive Officers
1.3.2 For Chief Marketing Officers
1.3.3 For Chief Strategy Officers
1.4 Evaluate the Potential of your Existing Business Lines vs. New Lines to Enter Into
2 TECHNOLOGICAL TRENDS
2.1 Technological Adoption Rate
2.2 Current Trend Impact Analysis
2.3 Future Trend Impact Analysis
3 GLOBAL MARKET OUTLOOK
3.1 Market Pyramid Analysis
3.1.1 Introduction
3.1.2 Adjacent Market Opportunities
3.1.3 Ancillary Market Opportunities
3.2 Demand Side Analysis
3.2.1 Market Drivers: Impact Analysis
3.2.2 Market Restraints: Impact Analysis
3.2.3 Market Opportunities: Impact Analysis
3.2.4 Market Challenges: Impact Analysis
3.3 Supply Side Analysis
3.3.1 Porter’s Five Forces Analysis
3.3.1.1 Threat of New Entrants
3.3.1.2 Threat of New Substitutes
3.3.1.3 Bargaining Power of Suppliers
3.3.1.4 Bargaining Power of Buyers
3.3.1.5 Intensity of Competitive Rivalry
3.3.2 SWOT Analysis; By Factor (Political & Legal, Economic, and Technological)
3.3.2.1 Political Landscape
3.3.2.2 Economic Landscape
3.3.2.3 Social Landscape
3.3.2.4 Technology Landscape
3.3.3 Value Chain Analysis
3.3.4 Trend Analysis
3.3.5 Gap Analysis
3.3.6 Cost Analysis
4 GLOBAL BIO-LNG MARKET, BY SOURCE TYPE
4.1 Introduction
4.2 Bio-LNG Market: Source Type Scope Key Takeaways
4.3 Revenue Growth Analysis, 2023 & 2029
4.4 Organic Household Waste
4.4.1 Organic Household Waste Market Estimates and Forecast, 2021-2029 (USD Million)
4.5 Organic Industrial Waste
4.5.1 Organic Industrial Waste Market Estimates and Forecast, 2021-2029 (USD Million)
4.6 Municipal Waste
4.6.1 Municipal Waste Market Estimates and Forecast, 2021-2029 (USD Million)
5 GLOBAL BIO-LNG MARKET, BY APPLICATION
5.1 Introduction
5.2 Bio-LNG Market: Application Scope Key Takeaways
5.3 Revenue Growth Analysis, 2023 & 2029
5.4 Transportation Fuel
5.4.1 Transportation Fuel Market Estimates and Forecast, 2021-2029 (USD Million)
5.5 Power Generation
5.5.1 Power Generation Market Estimates and Forecast, 2021-2029 (USD Million)
5.6 Others
5.6.1 Others Market Estimates and Forecast, 2021-2029 (USD Million)
6 GLOBAL BIO-LNG MARKET, BY REGION
6.1 Introduction
6.2 North America Bio-LNG Market Estimates and Forecast, 2021-2029 (USD Million)
6.2.1 By Source Type
6.2.2 By Application
6.2.3 By Country
6.2.3.1 U.S. Bio-LNG Market Estimates and Forecast, 2021-2029 (USD Million)
6.2.3.1.1 By Source Type
6.2.3.1.2 By Application
6.2.3.2 Canada Bio-LNG Market Estimates and Forecast, 2021-2029 (USD Million)
6.2.3.2.1 By Source Type
6.2.3.2.2 By Application
6.2.3.3 Mexico Bio-LNG Market Estimates and Forecast, 2021-2029 (USD Million)
6.2.3.3.1 By Source Type
6.2.3.3.2 By Application
6.3 Europe Bio-LNG Market Estimates and Forecast, 2021-2029 (USD Million)
6.3.1 By Source Type
6.3.2 By Application
6.3.3 By Country
6.3.3.1 Germany Bio-LNG Market Estimates and Forecast, 2021-2029 (USD Million)
6.3.3.1.1 By Source Type
6.3.3.1.2 By Application
6.3.3.2 U.K. Bio-LNG Market Estimates and Forecast, 2021-2029 (USD Million)
6.3.3.2.1 By Source Type
6.3.3.2.2 By Application
6.3.3.3 France Bio-LNG Market Estimates and Forecast, 2021-2029 (USD Million)
6.3.3.3.1 By Source Type
6.3.3.3.2 By Application
6.3.3.4 Italy Bio-LNG Market Estimates and Forecast, 2021-2029 (USD Million)
6.3.3.4.1 By Source Type
6.3.3.4.2 By Application
6.3.3.5 Spain Bio-LNG Market Estimates and Forecast, 2021-2029 (USD Million)
6.3.3.5.1 By Source Type
6.3.3.5.2 By Application
6.3.3.6 Netherlands Bio-LNG Market Estimates and Forecast, 2021-2029 (USD Million)
6.3.3.6.1 By Source Type
6.3.3.6.2 By Application
6.3.3.7 Rest of Europe Bio-LNG Market Estimates and Forecast, 2021-2029 (USD Million)
6.3.3.6.1 By Source Type
6.3.3.6.2 By Application
6.4 Asia Pacific Bio-LNG Market Estimates and Forecast, 2021-2029 (USD Million)
6.4.1 By Source Type
6.4.2 By Application
6.4.3 By Country
6.4.3.1 China Bio-LNG Market Estimates and Forecast, 2021-2029 (USD Million)
6.4.3.1.1 By Source Type
6.4.3.1.2 By Application
6.4.3.2 Japan Bio-LNG Market Estimates and Forecast, 2021-2029 (USD Million)
6.4.3.2.1 By Source Type
6.4.3.2.2 By Application
6.4.3.3 India Bio-LNG Market Estimates and Forecast, 2021-2029 (USD Million)
6.4.3.3.1 By Source Type
6.4.3.3.2 By Application
6.4.3.4 South Korea Bio-LNG Market Estimates and Forecast, 2021-2029 (USD Million)
6.4.3.4.1 By Source Type
6.4.3.4.2 By Application
6.4.3.5 Singapore Bio-LNG Market Estimates and Forecast, 2021-2029 (USD Million)
6.4.3.5.1 By Source Type
6.4.3.5.2 By Application
6.4.3.6 Malaysia Bio-LNG Market Estimates and Forecast, 2021-2029 (USD Million)
6.4.3.6.1 By Source Type
6.4.3.6.2 By Application
6.4.3.7 Thailand Bio-LNG Market Estimates and Forecast, 2021-2029 (USD Million)
6.4.3.6.1 By Source Type
6.4.3.6.2 By Application
6.4.3.8 Indonesia Bio-LNG Market Estimates and Forecast, 2021-2029 (USD Million)
6.4.3.7.1 By Source Type
6.4.3.7.2 By Application
6.4.3.9 Vietnam Bio-LNG Market Estimates and Forecast, 2021-2029 (USD Million)
6.4.3.8.1 By Source Type
6.4.3.8.2 By Application
6.4.3.10 Taiwan Bio-LNG Market Estimates and Forecast, 2021-2029 (USD Million)
6.4.3.10.1 By Source Type
6.4.3.10.2 By Application
6.4.3.11 Rest of Asia Pacific Bio-LNG Market Estimates and Forecast, 2021-2029 (USD Million)
6.4.3.11.1 By Source Type
6.4.3.11.2 By Application
6.5 Middle East and Africa Bio-LNG Market Estimates and Forecast, 2021-2029 (USD Million)
6.5.1 By Source Type
6.5.2 By Application
6.5.3 By Country
6.5.3.1 Saudi Arabia Bio-LNG Market Estimates and Forecast, 2021-2029 (USD Million)
6.5.3.1.1 By Source Type
6.5.3.1.2 By Application
6.5.3.2 U.A.E. Bio-LNG Market Estimates and Forecast, 2021-2029 (USD Million)
6.5.3.2.1 By Source Type
6.5.3.2.2 By Application
6.5.3.3 Israel Bio-LNG Market Estimates and Forecast, 2021-2029 (USD Million)
6.5.3.3.1 By Source Type
6.5.3.3.2 By Application
6.5.3.4 South Africa Bio-LNG Market Estimates and Forecast, 2021-2029 (USD Million)
6.5.3.4.1 By Source Type
6.5.3.4.2 By Application
6.5.3.5 Rest of Middle East and Africa Bio-LNG Market Estimates and Forecast, 2021-2029 (USD Million)
6.5.3.5.1 By Source Type
6.5.3.5.2 By Application
6.6 Central and South America Bio-LNG Market Estimates and Forecast, 2021-2029 (USD Million)
6.6.1 By Source Type
6.6.2 By Application
6.6.3 By Country
6.6.3.1 Brazil Bio-LNG Market Estimates and Forecast, 2021-2029 (USD Million)
6.6.3.1.1 By Source Type
6.6.3.1.2 By Application
6.6.3.2 Argentina Bio-LNG Market Estimates and Forecast, 2021-2029 (USD Million)
6.6.3.2.1 By Source Type
6.6.3.2.2 By Application
6.6.3.3 Chile Bio-LNG Market Estimates and Forecast, 2021-2029 (USD Million)
6.6.3.3.1 By Source Type
6.6.3.3.2 By Application
6.6.3.3 Rest of Central and South America Bio-LNG Market Estimates and Forecast, 2021-2029 (USD Million)
6.6.3.3.1 By Source Type
6.6.3.3.2 By Application
7 COMPETITIVE LANDCAPE
7.1 Company Market Share Analysis
7.2 Four Quadrant Positioning Matrix
7.2.1 Market Leaders
7.2.2 Market Visionaries
7.2.3 Market Challengers
7.2.4 Niche Market Players
7.3 Vendor Landscape
7.3.1 North America
7.3.2 Europe
7.3.3 Asia Pacific
7.3.4 Rest of the World
7.4 Company Profiles
7.4.1 Linde plc
7.4.1.1 Business Description & Financial Analysis
7.4.1.2 SWOT Analysis
7.4.1.3 Products & Services Offered
7.4.1.4 Strategic Alliances between Business Partners
7.4.2 Nordsol
7.4.2.1 Business Description & Financial Analysis
7.4.2.2 SWOT Analysis
7.4.2.3 Products & Services Offered
7.4.2.4 Strategic Alliances between Business Partners
7.4.3 Flogas Britain Ltd.
7.4.3.1 Business Description & Financial Analysis
7.4.3.2 SWOT Analysis
7.4.3.3 Products & Services Offered
7.4.3.4 Strategic Alliances between Business Partners
7.4.4 MEGA a.s.
7.4.4.1 Business Description & Financial Analysis
7.4.4.2 SWOT Analysis
7.4.4.3 Products & Services Offered
7.4.4.4 Strategic Alliances between Business Partners
7.4.5 TotalEnergies
7.4.5.1 Business Description & Financial Analysis
7.4.5.2 SWOT Analysis
7.4.5.3 Products & Services Offered
7.4.5.4 Strategic Alliances between Business Partners
7.4.6 AXEGAZ T&T
7.4.6.1 Business Description & Financial Analysis
7.4.6.2 SWOT Analysis
7.4.6.3 Products & Services Offered
7.4.6.4 Strategic Alliances between Business Partners
7.4.7 Titan LNG
7.4.7.1 Business Description & Financial Analysis
7.4.7.2 SWOT Analysis
7.4.7.3 Products & Services Offered
7.4.7.4 Strategic Alliances between Business Partners
7.4.8 DBG Group B.V.
7.4.8.1 Business Description & Financial Analysis
7.4.8.2 SWOT Analysis
7.4.8.3 Products & Services Offered
7.4.8.4 Strategic Alliances between Business Partners
7.4.9 BoxLNG Pvt. Ltd.
7.4.9.1 Business Description & Financial Analysis
7.4.9.2 SWOT Analysis
7.4.9.3 Products & Services Offered
7.4.9.4 Strategic Alliances between Business Partners
7.4.10 Shell Plc
7.4.10.1 Business Description & Financial Analysis
7.4.10.2 SWOT Analysis
7.4.10.3 Products & Services Offered
7.4.10.4 Strategic Alliances between Business Partners
7.4.11 Other Companies
7.4.11.1 Business Description & Financial Analysis
7.4.11.2 SWOT Analysis
7.4.11.3 Products & Services Offered
7.4.11.4 Strategic Alliances between Business Partners
8 RESEARCH METHODOLOGY
8.1 Market Introduction
8.1.1 Market Definition
8.1.2 Market Scope & Segmentation
8.2 Information Procurement
8.2.1 Secondary Research
8.2.1.1 Purchased Databases
8.2.1.2 GMEs Internal Data Repository
8.2.1.3 Secondary Resources & Third Party Perspectives
8.2.1.4 Company Information Sources
8.2.2 Primary Research
8.2.2.1 Various Types of Respondents for Primary Interviews
8.2.2.2 Number of Interviews Conducted throughout the Research Process
8.2.2.3 Primary Stakeholders
8.2.2.4 Discussion Guide for Primary Participants
8.2.3 Expert Panels
8.2.3.1 Expert Panels Across 30+ Industry
8.2.4 Paid Local Experts
8.2.4.1 Paid Local Experts Across 30+ Industry Across each Region
8.3 Market Estimation
8.3.1 Top-Down Approach
8.3.1.1 Macro-Economic Indicators Considered
8.3.1.2 Micro-Economic Indicators Considered
8.3.2 Bottom Up Approach
8.3.2.1 Company Share Analysis Approach
8.3.2.2 Estimation of Potential Product Sales
8.4 Data Triangulation
8.4.1 Data Collection
8.4.2 Time Series, Cross Sectional & Panel Data Analysis
8.4.3 Cluster Analysis
8.5 Analysis and Output
8.5.1 Inhouse AI Based Real Time Analytics Tool
8.5.2 Output From Desk & Primary Research
8.6 Research Assumptions & Limitations
8.6.1 Research Assumptions
8.6.2 Research Limitations
LIST OF TABLES
1 Global Bio-LNG Market, By Source Type, 2021-2029 (USD Million)
2 Organic Household Waste Market, By Region, 2021-2029 (USD Million)
3 Organic Industrial Waste Market, By Region, 2021-2029 (USD Million)
4 Municipal Waste Market, By Region, 2021-2029 (USD Million)
5 Global Bio-LNG Market, By Application, 2021-2029 (USD Million)
6 Transportation Fuel Market, By Region, 2021-2029 (USD Million)
7 Power Generation Market, By Region, 2021-2029 (USD Million)
8 Others Market, By Region, 2021-2029 (USD Million)
9 Regional Analysis, 2021-2029 (USD Million)
10 North America Bio-LNG Market, By Source Type, 2021-2029 (USD Million)
11 North America Bio-LNG Market, By Application, 2021-2029 (USD Million)
12 North America Bio-LNG Market, By COUNTRY, 2021-2029 (USD Million)
13 U.S. Bio-LNG Market, By Source Type, 2021-2029 (USD Million)
14 U.S. Bio-LNG Market, By Application, 2021-2029 (USD Million)
15 Canada Bio-LNG Market, By Source Type, 2021-2029 (USD Million)
16 Canada Bio-LNG Market, By Application, 2021-2029 (USD Million)
17 Mexico Bio-LNG Market, By Source Type, 2021-2029 (USD Million)
18 Mexico Bio-LNG Market, By Application, 2021-2029 (USD Million)
19 Europe Bio-LNG Market, By Source Type, 2021-2029 (USD Million)
20 Europe Bio-LNG Market, By Application, 2021-2029 (USD Million)
21 Europe Bio-LNG Market, By Country, 2021-2029 (USD Million)
22 Germany Bio-LNG Market, By Source Type, 2021-2029 (USD Million)
23 Germany Bio-LNG Market, By Application, 2021-2029 (USD Million)
24 U.K. Bio-LNG Market, By Source Type, 2021-2029 (USD Million)
25 U.K. Bio-LNG Market, By Application, 2021-2029 (USD Million)
26 France Bio-LNG Market, By Source Type, 2021-2029 (USD Million)
27 France Bio-LNG Market, By Application, 2021-2029 (USD Million)
28 Italy Bio-LNG Market, By Source Type, 2021-2029 (USD Million)
29 Italy Bio-LNG Market, By Application, 2021-2029 (USD Million)
30 Spain Bio-LNG Market, By Source Type, 2021-2029 (USD Million)
31 Spain Bio-LNG Market, By Application, 2021-2029 (USD Million)
32 Netherlands Bio-LNG Market, By Source Type, 2021-2029 (USD Million)
33 Netherlands Bio-LNG Market, By Application, 2021-2029 (USD Million)
34 Rest Of Europe Bio-LNG Market, By Source Type, 2021-2029 (USD Million)
35 Rest Of Europe Bio-LNG Market, By Application, 2021-2029 (USD Million)
36 Asia Pacific Bio-LNG Market, By Source Type, 2021-2029 (USD Million)
37 Asia Pacific Bio-LNG Market, By Application, 2021-2029 (USD Million)
38 Asia Pacific Bio-LNG Market, By Country, 2021-2029 (USD Million)
39 China Bio-LNG Market, By Source Type, 2021-2029 (USD Million)
40 China Bio-LNG Market, By Application, 2021-2029 (USD Million)
41 Japan Bio-LNG Market, By Source Type, 2021-2029 (USD Million)
42 Japan Bio-LNG Market, By Application, 2021-2029 (USD Million)
43 India Bio-LNG Market, By Source Type, 2021-2029 (USD Million)
44 India Bio-LNG Market, By Application, 2021-2029 (USD Million)
45 South Korea Bio-LNG Market, By Source Type, 2021-2029 (USD Million)
46 South Korea Bio-LNG Market, By Application, 2021-2029 (USD Million)
47 Singapore Bio-LNG Market, By Source Type, 2021-2029 (USD Million)
48 Singapore Bio-LNG Market, By Application, 2021-2029 (USD Million)
49 Thailand Bio-LNG Market, By Source Type, 2021-2029 (USD Million)
50 Thailand Bio-LNG Market, By Application, 2021-2029 (USD Million)
51 Malaysia Bio-LNG Market, By Source Type, 2021-2029 (USD Million)
52 Malaysia Bio-LNG Market, By Application, 2021-2029 (USD Million)
53 Indonesia Bio-LNG Market, By Source Type, 2021-2029 (USD Million)
54 Indonesia Bio-LNG Market, By Application, 2021-2029 (USD Million)
55 Vietnam Bio-LNG Market, By Source Type, 2021-2029 (USD Million)
56 Vietnam Bio-LNG Market, By Application, 2021-2029 (USD Million)
57 Taiwan Bio-LNG Market, By Source Type, 2021-2029 (USD Million)
58 Taiwan Bio-LNG Market, By Application, 2021-2029 (USD Million)
59 Rest of APAC Bio-LNG Market, By Source Type, 2021-2029 (USD Million)
60 Rest of APAC Bio-LNG Market, By Application, 2021-2029 (USD Million)
61 Middle East and Africa Bio-LNG Market, By Source Type, 2021-2029 (USD Million)
62 Middle East and Africa Bio-LNG Market, By Application, 2021-2029 (USD Million)
63 Middle East and Africa Bio-LNG Market, By Country, 2021-2029 (USD Million)
64 Saudi Arabia Bio-LNG Market, By Source Type, 2021-2029 (USD Million)
65 Saudi Arabia Bio-LNG Market, By Application, 2021-2029 (USD Million)
66 UAE Bio-LNG Market, By Source Type, 2021-2029 (USD Million)
67 UAE Bio-LNG Market, By Application, 2021-2029 (USD Million)
68 Israel Bio-LNG Market, By Source Type, 2021-2029 (USD Million)
69 Israel Bio-LNG Market, By Application, 2021-2029 (USD Million)
70 South Africa Bio-LNG Market, By Source Type, 2021-2029 (USD Million)
71 South Africa Bio-LNG Market, By Application, 2021-2029 (USD Million)
72 Rest Of Middle East and Africa Bio-LNG Market, By Source Type, 2021-2029 (USD Million)
73 Rest Of Middle East and Africa Bio-LNG Market, By Application, 2021-2029 (USD Million)
74 Central and South America Bio-LNG Market, By Source Type, 2021-2029 (USD Million)
75 Central and South America Bio-LNG Market, By Application, 2021-2029 (USD Million)
76 Central and South America Bio-LNG Market, By Country, 2021-2029 (USD Million)
77 Brazil Bio-LNG Market, By Source Type, 2021-2029 (USD Million)
78 Brazil Bio-LNG Market, By Application, 2021-2029 (USD Million)
79 Chile Bio-LNG Market, By Source Type, 2021-2029 (USD Million)
80 Chile Bio-LNG Market, By Application, 2021-2029 (USD Million)
81 Argentina Bio-LNG Market, By Source Type, 2021-2029 (USD Million)
82 Argentina Bio-LNG Market, By Application, 2021-2029 (USD Million)
83 Rest Of Central and South America Bio-LNG Market, By Source Type, 2021-2029 (USD Million)
84 Rest Of Central and South America Bio-LNG Market, By Application, 2021-2029 (USD Million)
85 Linde plc: Products & Services Offering
86 Nordsol: Products & Services Offering
87 Flogas Britain Ltd.: Products & Services Offering
88 MEGA a.s.: Products & Services Offering
89 TotalEnergies: Products & Services Offering
90 AXEGAZ T&T: Products & Services Offering
91 Titan LNG : Products & Services Offering
92 DBG Group B.V.: Products & Services Offering
93 BoxLNG Pvt. Ltd., Inc: Products & Services Offering
94 Shell Plc: Products & Services Offering
95 Other Companies: Products & Services Offering
LIST OF FIGURES
1 Global Bio-LNG Market Overview
2 Global Bio-LNG Market Value From 2021-2029 (USD Million)
3 Global Bio-LNG Market Share, By Source Type (2023)
4 Global Bio-LNG Market Share, By Application (2023)
5 Global Bio-LNG Market, By Region (Asia Pacific Market)
6 Technological Trends In Global Bio-LNG Market
7 Four Quadrant Competitor Positioning Matrix
8 Impact Of Macro & Micro Indicators On The Market
9 Impact Of Key Drivers On The Global Bio-LNG Market
10 Impact Of Challenges On The Global Bio-LNG Market
11 Porter’s Five Forces Analysis
12 Global Bio-LNG Market: By Source Type Scope Key Takeaways
13 Global Bio-LNG Market, By Source Type Segment: Revenue Growth Analysis
14 Organic Household Waste Market, By Region, 2021-2029 (USD Million)
15 Organic Industrial Waste Market, By Region, 2021-2029 (USD Million)
16 Municipal Waste Market, By Region, 2021-2029 (USD Million)
17 Global Bio-LNG Market: By Application Scope Key Takeaways
18 Global Bio-LNG Market, By Application Segment: Revenue Growth Analysis
19 Transportation Fuel Market, By Region, 2021-2029 (USD Million)
20 Power Generation Market, By Region, 2021-2029 (USD Million)
21 Others Market, By Region, 2021-2029 (USD Million)
22 Regional Segment: Revenue Growth Analysis
23 Global Bio-LNG Market: Regional Analysis
24 North America Bio-LNG Market Overview
25 North America Bio-LNG Market, By Source Type
26 North America Bio-LNG Market, By Application
27 North America Bio-LNG Market, By Country
28 U.S. Bio-LNG Market, By Source Type
29 U.S. Bio-LNG Market, By Application
30 Canada Bio-LNG Market, By Source Type
31 Canada Bio-LNG Market, By Application
32 Mexico Bio-LNG Market, By Source Type
33 Mexico Bio-LNG Market, By Application
34 Four Quadrant Positioning Matrix
35 Company Market Share Analysis
36 Linde plc: Company Snapshot
37 Linde plc: SWOT Analysis
38 Linde plc: Geographic Presence
39 Nordsol: Company Snapshot
40 Nordsol: SWOT Analysis
41 Nordsol: Geographic Presence
42 Flogas Britain Ltd.: Company Snapshot
43 Flogas Britain Ltd.: SWOT Analysis
44 Flogas Britain Ltd.: Geographic Presence
45 MEGA a.s.: Company Snapshot
46 MEGA a.s.: Swot Analysis
47 MEGA a.s.: Geographic Presence
48 TotalEnergies: Company Snapshot
49 TotalEnergies: SWOT Analysis
50 TotalEnergies: Geographic Presence
51 AXEGAZ T&T: Company Snapshot
52 AXEGAZ T&T: SWOT Analysis
53 AXEGAZ T&T: Geographic Presence
54 Titan LNG : Company Snapshot
55 Titan LNG : SWOT Analysis
56 Titan LNG : Geographic Presence
57 DBG Group B.V.: Company Snapshot
58 DBG Group B.V.: SWOT Analysis
59 DBG Group B.V.: Geographic Presence
60 BoxLNG Pvt. Ltd., Inc.: Company Snapshot
61 BoxLNG Pvt. Ltd., Inc.: SWOT Analysis
62 BoxLNG Pvt. Ltd., Inc.: Geographic Presence
63 Shell Plc: Company Snapshot
64 Shell Plc: SWOT Analysis
65 Shell Plc: Geographic Presence
66 Other Companies: Company Snapshot
67 Other Companies: SWOT Analysis
68 Other Companies: Geographic Presence
The Global Bio-LNG Market has been studied from the year 2019 till 2029. However, the CAGR provided in the report is from the year 2024 to 2029. The research methodology involved three stages: Desk research, Primary research, and Analysis & Output from the entire research process.

The desk research involved a robust background study which meant referring to paid and unpaid databases to understand the market dynamics; mapping contracts from press releases; identifying the key players in the market, studying their product portfolio, competition level, annual reports/SEC filings & investor presentations; and learning the demand and supply-side analysis for the Bio-LNG Market.

The primary research activity included telephonic conversations with more than 50 tier 1 industry consultants, distributors, and end-use product manufacturers.

Finally, based on the above thorough research process, an in-depth analysis was carried out considering the following aspects: market attractiveness, current & future market trends, market share analysis, SWOT analysis of the company and customer analytics.

Frequently Asked Questions

This FREE sample includes market data points, ranging from trend analyses to market estimates & forecasts. See for yourself.
Or view our licence options:
Tailor made solutions just for you
80% of our clients seek made-to-order reports. How do you want us to tailor yours?
OUR CLIENTS


