Global Chemical Fillers Market Size, Trends, and Analysis - Forecasts to 2026 By Product Type (Organic [Shell Flour, Wood Flour, Others], Inorganic [Calcium Carbonate, Talc, Silica, Kaolin, Calcium Sulfate, Alumina Trihydrate, Others]), By Application (Paper, Thermoplastic and Thermoset, Paints and Coatings, Rubber, Adhesives and Sealants, Others [Showers, Automobile Parts), Region (North America, Asia Pacific, CSA, Europe, and the Middle East and Africa), Company Market Share Analysis, and Competitor Analysis
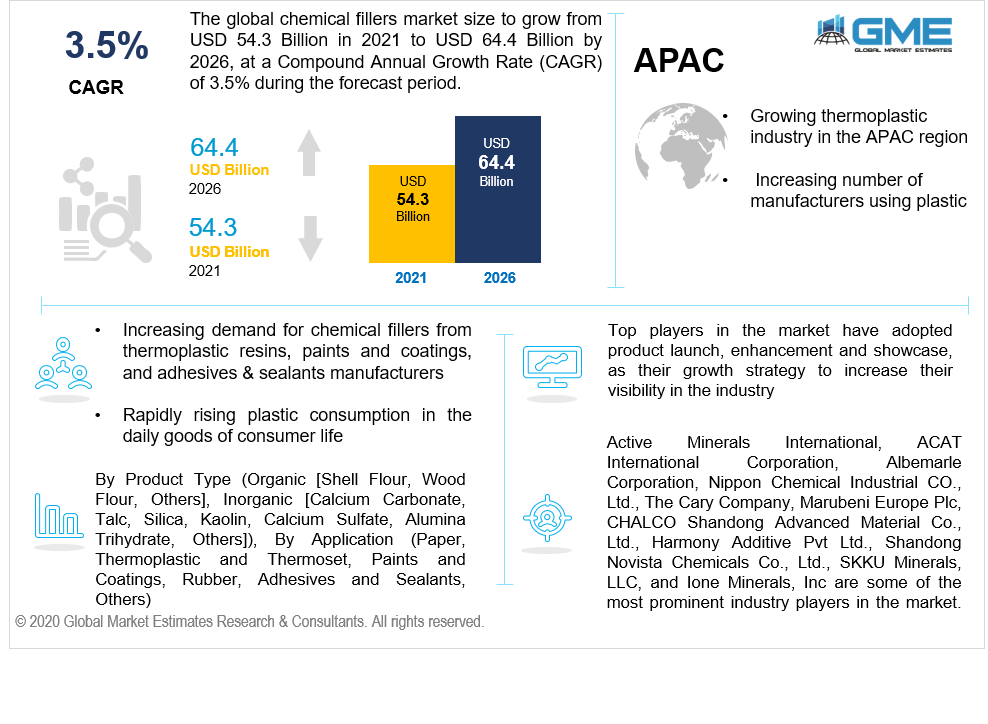
The global chemical fillers market will grow from USD 54.3 billion in 2021 to USD 64.4 billion by 2026 at a CAGR value of 3.5% from 2021 to 2026.
Increasing demand for chemical fillers from thermoplastic resins, paints and coatings, and adhesives & sealants manufacturers is a prime driving factor for the global chemical fillers market’s growth. Rapidly rising plastic consumption in the daily goods of consumer life, growing infrastructural development, and urbanization are some of the other factors supporting the growth of the market from 2021 to 2026.
Chemical fillers are ingredient that are treated as additives or binders to various sorts of materials to improve their specific characteristics. As substitutes to original substances, these chemical fillers make the final product cheaper than its actual value. Every year, manufacturers from various verticals across the globe utilize approximately 53 million tons of chemical fillers as binders in their production.
These chemical fillers act as the raw materials for many producers worldwide and are majorly utilised in various products which are eventually used in everyday consumer needs. With their specific properties, these fillers cover up the space that is supposed to be filled by high priced resins and make the products less expensive without damaging the product's original properties. These fillers also enable the manufacturers to use any preferred properties like color, density, odor, insulation, and others.
However, as these chemical fillers add extended life to the manufactured products, they also increase the possibility of showcasing non-degradable properties into the products. Irrespective of the advantage of longevity and satisfactory usage for the consumers, these non-degradable products causes tremendous harm to the environment, and hence this poses as a restraint for the market to grow.
The COVID-19 pandemic has had a negative effect on the chemical industry owing to disruption in raw material supply, shut down of manufacturing units, low consumption rate for plastic products and reduced production volume of ready-goods. However, with the ease in lockdown norms, the market is expected to pick up the pace and grow exponentially from 2021 to 2026.

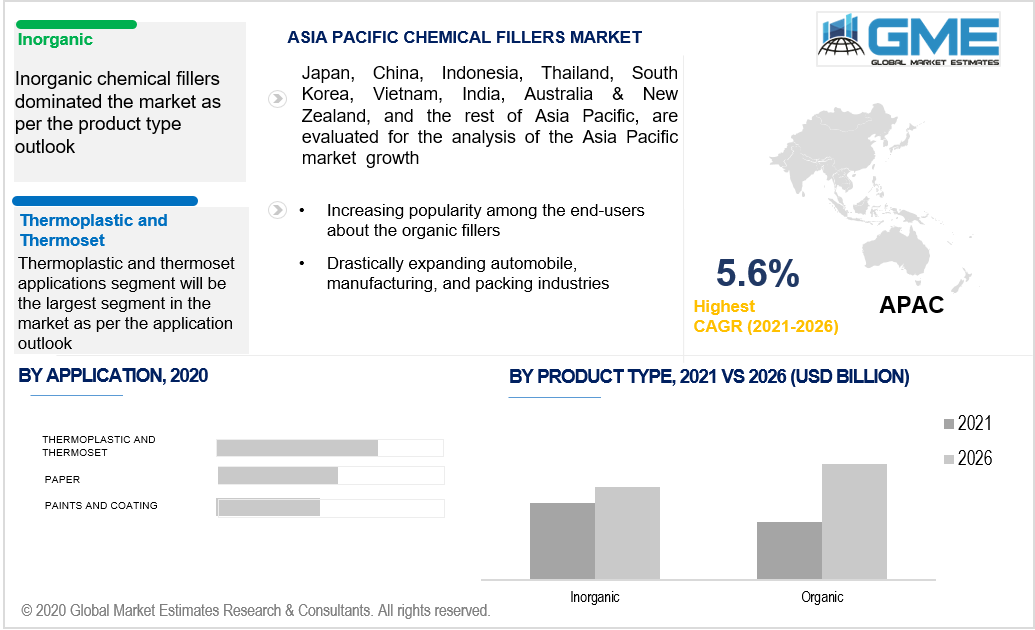
Based on the type, the market is segmented into organic [shell flour, wood flour, others], and inorganic [calcium carbonate, talc, silica, kaolin, calcium sulfate, alumina trihydrate, others]. Inorganic chemical fillers dominated the market.
Approximately 60% of the end-user industries use inorganic chemical fillers in their production processes. Due to their ease in availability in the market, these are considerably low in cost as compared to the organic fillers. Inorganic fillers also improve the physical and structural performance of the final results. They increase the stability, rigidity, inflammability, and sustainability of the products to which they are added.
Based on the application, the market is segmented into paper, thermoplastic and thermoset, paints and coatings, rubber, adhesives and sealants, and others [showers, automobile parts]. Amongst these, chemical fillers are tremendously used in thermoplastic and thermoset applications and hence the thermoplastic and thermoset applications segment will be the largest segment in the market.
The global consumption of plastic has drastically increased in the last few decades. Plastic is being used in various verticals. In order to increase the life of the products, manufacturers use chemical fillers in applications of thermoplastic and thermoset. Irrespective of plastic being non-degradable in nature, it is highly prone to high temperatures or excessive heat from sunlight. This kind of degradation can take place during high heat in the processing stage or once the final product is in service. It can showcase signs of brittleness, reduction in physical strength and properties, discoloration, or reduced sustenance. These chemical fillers act as a shield for applications like thermoplastic to reduce the deterioration process and increase the lifespan of the product.
Approximately 39% of thermoplastics are used in the packaging industry, followed by 21% in the construction and building industry and 8% in the automobile industry.
Use of chemical fillers in the applications of thermoplastic and thermoset have negative impact on the environment. Many stringent rules and regulations have been implemented in restricting the increasing usage; however, their increased efficiency in delivering service and the quality of satisfying customer's requirements has taken over the implemented restrictions.

Based on region, the market has be segmented into various regions such as North America, Europe, Central and South America, Middle East and Africa, and Asia Pacific regions.
Asia Pacific region holds its dominance over the chemical fillers market. Countries like Japan, India and China in the APAC region are well known for being the top markets for thermoplastic. These countries are the most prominent manufacturers of plastic and the most demanding consumers of plastic in various verticals as well.
Active Minerals International, ACAT International Corporation, Albemarle Corporation, Nippon Chemical Industrial CO., Ltd., The Cary Company, Marubeni Europe Plc, CHALCO Shandong Advanced Material Co., Ltd., Harmony Additive Pvt Ltd., Shandong Novista Chemicals Co., Ltd., SKKU Minerals, LLC, and Ione Minerals, Inc are some of the most prominent industry players in the market.
Please note: This is not an exhaustive list of companies profiled in the report.
Chapter 1 Methodology
1.1 Market Scope & Definitions
1.2 Estimates & Forecast Calculation
1.3 Historical Data Overview and Validation
1.4 Data Sources
1.4.1 Secondary
1.4.2 Primary
Chapter 2 Report Outlook
2.1 Chemical Fillers Industry Overview, 2020-2026
2.1.1 Industry Overview
2.1.2 Type Overview
2.1.3 Application Overview
2.1.4 Regional Overview
Chapter 3 Chemical Fillers Market Trends
3.1 Market Segmentation
3.2 Industry Background, 2020-2026
3.3 Market Key Trends
3.3.1 Positive Trends
3.3.1.1 Increasing demand for chemical fillers from thermoplastic resins, paints and coatings, and adhesives & sealants manufacturers
3.3.2 Industry Challenges
3.3.2.1 Rising environmental related concerns
3.4 Prospective Growth Scenario
3.4.1 Type Growth Scenario
3.4.2 Application Growth Scenario
3.5 COVID-19 Influence over Industry Growth
3.6 Porter’s Analysis
3.7 PESTEL Analysis
3.8 Value Chain & Supply Chain Analysis
3.9 Regulatory Framework
3.9.1 North America
3.9.2 Europe
3.9.3 APAC
3.9.4 LATAM
3.9.5 MEA
3.10 Application Overview
3.11 Market Share Analysis, 2020
3.11.1 Company Positioning Overview, 2020
Chapter 4 Chemical Fillers Market, By Type
4.1 Type Outlook
4.2 Organic
4.2.1 Market Size, By Region, 2020-2026 (USD Billion)
4.3 Inorganic
4.3.1 Market Size, By Region, 2020-2026 (USD Billion)
Chapter 5 Chemical Fillers Market, By Application
5.1 Application Outlook
5.2 Paper
5.2.1 Market Size, By Region, 2020-2026 (USD Billion)
5.3 Thermoplastic and Thermoset
5.3.1 Market Size, By Region, 2020-2026 (USD Billion)
5.4 Paints and Coatings
5.4.1 Market Size, By Region, 2020-2026 (USD Billion)
5.5 Rubber
5.5.1 Market Size, By Region, 2020-2026 (USD Billion)
5.6 Adhesives and Sealants
5.6.1 Market Size, By Region, 2020-2026 (USD Billion)
5.6 Others
5.6.1 Market Size, By Region, 2020-2026 (USD Billion)
Chapter 6 Chemical Fillers Market, By Region
6.1 Regional outlook
6.2 North America
6.2.1 Market Size, By Country 2020-2026 (USD Billion)
6.2.2 Market Size, By Type, 2020-2026 (USD Billion)
6.2.3 Market Size, By Application, 2020-2026 (USD Billion)
6.2.4 U.S.
6.2.4.1 Market Size, By Type, 2020-2026 (USD Billion)
6.2.4.2 Market Size, By Application, 2020-2026 (USD Billion)
6.2.5 Canada
6.2.5.1 Market Size, By Type, 2020-2026 (USD Billion)
6.2.5.2 Market Size, By Application, 2020-2026 (USD Billion)
6.3 Europe
6.3.1 Market Size, By Country 2020-2026 (USD Billion)
6.3.2 Market Size, By Type, 2020-2026 (USD Billion)
6.3.3 Market Size, By Application, 2020-2026 (USD Billion)
6.3.4 Germany
6.3.4.1 Market Size, By Type, 2020-2026 (USD Billion)
6.3.4.2 Market Size, By Application, 2020-2026 (USD Billion)
6.3.5 UK
6.3.5.1 Market Size, By Type, 2020-2026 (USD Billion)
6.3.5.2 Market Size, By Application, 2020-2026 (USD Billion)
6.3.6 France
6.3.6.1 Market Size, By Type, 2020-2026 (USD Billion)
6.3.6.2 Market Size, By Application, 2020-2026 (USD Billion)
6.3.7 Italy
6.3.7.1 Market Size, By Type, 2020-2026 (USD Billion)
6.3.7.2 Market Size, By Application, 2020-2026 (USD Billion)
6.3.8 Spain
6.3.8.1 Market Size, By Type, 2020-2026 (USD Billion)
6.3.8.2 Market Size, By Application, 2020-2026 (USD Billion)
6.3.9 Russia
6.3.9.1 Market Size, By Type, 2020-2026 (USD Billion)
6.3.9.2 Market Size, By Application, 2020-2026 (USD Billion)
6.4 Asia Pacific
6.4.1 Market Size, By Country 2020-2026 (USD Billion)
6.4.2 Market Size, By Type, 2020-2026 (USD Billion)
6.4.3 Market Size, By Application, 2020-2026 (USD Billion)
6.4.4 China
6.4.4.1 Market Size, By Type, 2020-2026 (USD Billion)
6.4.4.2 Market Size, By Application, 2020-2026 (USD Billion)
6.4.5 India
6.4.5.1 Market Size, By Type, 2020-2026 (USD Billion)
6.4.5.2 Market Size, By Application, 2020-2026 (USD Billion)
6.4.6 Japan
6.4.6.1 Market Size, By Type, 2020-2026 (USD Billion)
6.4.6.2 Market Size, By Application, 2020-2026 (USD Billion)
6.4.7 Australia
6.4.7.1 Market Size, By Type, 2020-2026 (USD Billion)
6.4.7.2 Market size, By Application, 2020-2026 (USD Billion)
6.4.8 South Korea
6.4.8.1 Market Size, By Type, 2020-2026 (USD Billion)
6.4.8.2 Market Size, By Application, 2020-2026 (USD Billion)
6.5 Latin America
6.5.1 Market Size, By Country 2020-2026 (USD Billion)
6.5.2 Market Size, By Type, 2020-2026 (USD Billion)
6.5.3 Market Size, By Application, 2020-2026 (USD Billion)
6.5.4 Brazil
6.5.4.1 Market Size, By Type, 2020-2026 (USD Billion)
6.5.4.2 Market Size, By Application, 2020-2026 (USD Billion)
6.5.5 Mexico
6.5.5.1 Market Size, By Type, 2020-2026 (USD Billion)
6.5.5.2 Market Size, By Application, 2020-2026 (USD Billion)
6.5.6 Argentina
6.5.6.1 Market Size, By Type, 2020-2026 (USD Billion)
6.5.6.2 Market Size, By Application, 2020-2026 (USD Billion)
6.6 MEA
6.6.1 Market Size, By Country 2020-2026 (USD Billion)
6.6.2 Market Size, By Type, 2020-2026 (USD Billion)
6.6.3 Market Size, By Application, 2020-2026 (USD Billion)
6.6.4 Saudi Arabia
6.6.4.1 Market Size, By Type, 2020-2026 (USD Billion)
6.6.4.2 Market Size, By Application, 2020-2026 (USD Billion)
6.6.5 UAE
6.6.5.1 Market Size, By Type, 2020-2026 (USD Billion)
6.6.5.2 Market Size, By Application, 2020-2026 (USD Billion)
6.6.6 South Africa
6.6.6.1 Market Size, By Type, 2020-2026 (USD Billion)
6.6.6.2 Market Size, By Application, 2020-2026 (USD Billion)
Chapter 7 Company Landscape
7.1 Competitive Analysis, 2020
7.2 Active Minerals International
7.2.1 Company Overview
7.2.2 Financial Analysis
7.2.3 Strategic Positioning
7.2.4 Info Graphic Analysis
7.3 ACAT International Corporation
7.3.1 Company Overview
7.3.2 Financial Analysis
7.3.3 Strategic Positioning
7.3.4 Info Graphic Analysis
7.4 Albemarle Corporation
7.4.1 Company Overview
7.4.2 Financial Analysis
7.4.3 Strategic Positioning
7.4.4 Info Graphic Analysis
7.5 Nippon Chemical Industrial CO., Ltd.
7.5.1 Company Overview
7.5.2 Financial Analysis
7.5.3 Strategic Positioning
7.5.4 Info Graphic Analysis
7.6 The Cary Company
7.6.1 Company Overview
7.6.2 Financial Analysis
7.6.3 Strategic Positioning
7.6.4 Info Graphic Analysis
7.7 Marubeni Europe Plc
7.7.1 Company Overview
7.7.2 Financial Analysis
7.7.3 Strategic Positioning
7.7.4 Info Graphic Analysis
7.8 CHALCO Shandong Advanced Material Co., Ltd
7.8.1 Company Overview
7.8.2 Financial Analysis
7.8.3 Strategic Positioning
7.8.4 Info Graphic Analysis
7.9 Harmony Additive Pvt Ltd.
7.9.1 Company Overview
7.9.2 Financial Analysis
7.9.3 Strategic Positioning
7.9.4 Info Graphic Analysis
7.10 Other Companies
7.10.1 Company Overview
7.10.2 Financial Analysis
7.10.3 Strategic Positioning
7.10.4 Info Graphic Analysis
The Global Chemical Fillers Market has been studied from the year 2019 till 2026. However, the CAGR provided in the report is from the year 2021 to 2026. The research methodology involved three stages: Desk research, Primary research, and Analysis & Output from the entire research process.

The desk research involved a robust background study which meant referring to paid and unpaid databases to understand the market dynamics; mapping contracts from press releases; identifying the key players in the market, studying their product portfolio, competition level, annual reports/SEC filings & investor presentations; and learning the demand and supply-side analysis for the Chemical Fillers Market.

The primary research activity included telephonic conversations with more than 50 tier 1 industry consultants, distributors, and end-use product manufacturers.

Finally, based on the above thorough research process, an in-depth analysis was carried out considering the following aspects: market attractiveness, current & future market trends, market share analysis, SWOT analysis of the company and customer analytics.

Frequently Asked Questions
Tailor made solutions just for you
80% of our clients seek made-to-order reports. How do you want us to tailor yours?
OUR CLIENTS