This report was recently updated on April 9 2025 with the latest and most recent
market numbers
Global Co-Packaged Optics Market Size, Trends & Analysis - Forecasts to 2029 By Type (CPO and NPO), By Data Rates (Less than 1.6 T & 1.6 T, 3.2 T, and 6.4 T), By Application (Data Centers and High-performance Computing (HPC), Telecommunications and Networking, and Others), and By Region (North America, Asia Pacific, Central and South America, Europe, and Middle East and Africa), Competitive Landscape, Company Market Share Analysis, and End User Analysis
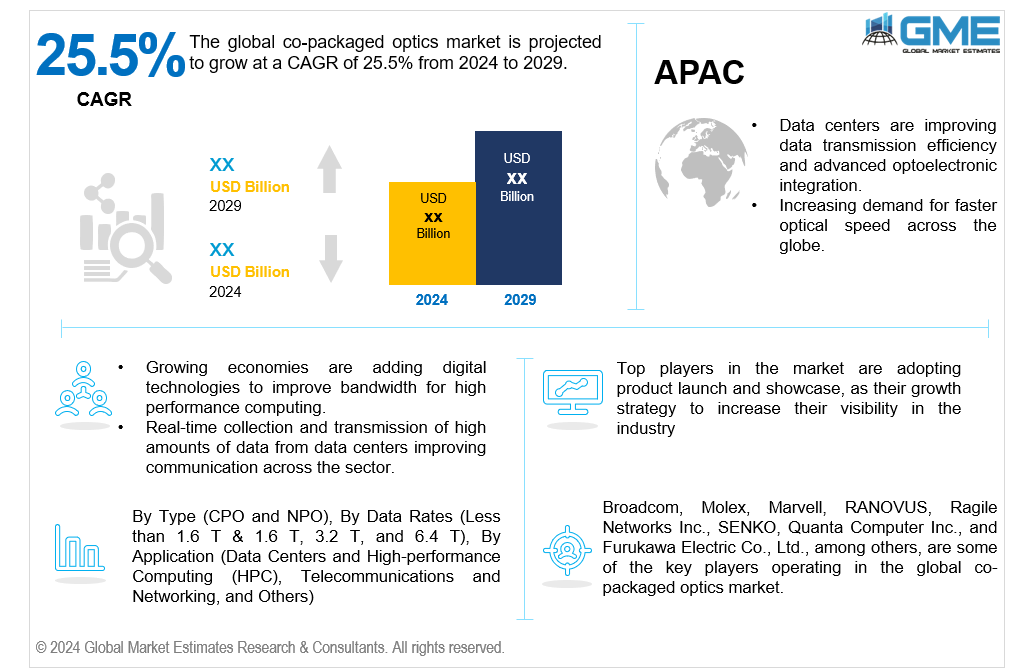
The global co-packaged optics market is projected to grow at a CAGR of 10.2% from 2024 to 2029.
Co-packaged optics (CPO) is a cutting-edge technology used mostly in data centers and high-performance computing environments that directly integrates optical components with electronic devices. This integration reduces the distance that electrical signals need to travel before being converted into optical signals by combining optical transceivers and switching ASICs (Application-Specific Integrated Circuits) into a single unit. This design improves efficiency and speed by minimizing signal loss and delays that occur when signals have to travel longer distances through electrical connections. This shorter distance reduces power consumption and signal loss, resulting in faster and more effective data transfer. CPO technology becomes an essential tool for meeting the demands for more bandwidth as data centers continue to grow and expand.
By combining switch ASICs with optical transceivers, co-packaged optics applications improve performance and lower power consumption. This is achieved in data center optics by shortening electrical paths, which results in lower power consumption and higher data transfer rates. Because of its co-packaged architecture, heat is dispersed more efficiently, increasing system dependability and efficiency. This establishes CPO as a crucial component of optical interconnects, co-packaged optics, and emerging optics technologies, as well as high-speed interconnect solutions.
The market is undergoing a number of changes, such as improvements in chiplet integration to overcome thermal management in optics and breakthroughs in optics packaging. Optics packaging challenges like heat dissipation inside integrated components, enhancing thermal management in optics remains a vital priority and development moves forward. These patterns demonstrate continuous efforts to improve co-packaged optical solutions' scalability, performance, and dependability, establishing them as essential to satisfying the rising demand for fast, energy-efficient data transfer in contemporary computer environments.
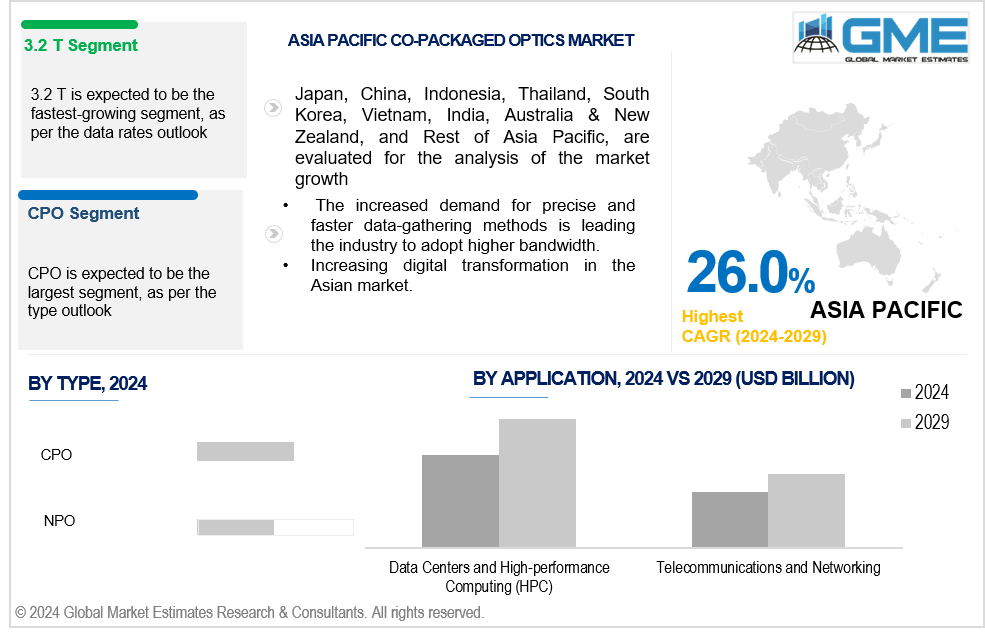
The NPO segment is expected to witness the fastest growth in the market over the forecast period. Network performance optimization (NPO) focuses on improving network performance and design while keeping costs as low as possible, improving usability and productivity and enabling efficient data interchange. In order to ensure effective operations, it is essential to manage traffic volume, network bandwidth, traffic direction, and network latency. Organizations can develop more efficient internal and external networks that match the demands of contemporary data-intensive applications by including optical transceiver modules into their network optimization strategies. This improves data transmission efficiency even further.
The CPO segment is expected to hold the largest market share over the forecast period. The CPO segment is poised to dominate the market, as innovation in system and chip architectures is crucial to meet escalating network and computational capacities. Initially used for long-haul communications, optics now spans shorter distances within data centers. Pluggable optical transceivers, vital in optical communication systems, boost bandwidth density both inside and outside racks, advancing from 100G to 400G, 800G, and 1.6T speeds. However, their higher speeds increase power consumption, notably in AI and other data-intensive applications. Co-packaged optics architectures and co-packaged optics development aim to integrate optical components directly into chip architectures, optimizing power usage and enhancing data transmission efficiency in modern computing environments.
The less than 1.6 T & 1.6 T segments are analyzed to hold the largest share of the market during the forecast period. Data rates of 1.6 terabits per second (T) are driving growth in the co-packaged optics market by enabling higher bandwidth for data centers and telecommunications networks. This increased capacity allows for faster data transmission, which is crucial as demand for cloud services and high-speed applications continues to rise.
The 3.2 T segment is anticipated to be the fastest-growing segment in the market from 2024 to 2029. Advanced optical transceiver modules that support data rates of 3.2 terabits per second (T) are crucial for providing high-bandwidth optical links. This level of data transmission is essential for meeting the increasing demands of cloud computing and large-scale data centers. The use of silicon photonics technology further improves efficiency and performance, enabling faster and more reliable network connections. As a result, the co-packaged optics market is growing rapidly to keep up with these evolving data rate requirements.
The data centers and high-performance computing (HPC) segment is analysed to hold the largest share of the market during the forecast period. The data centers and HPC is experiencing growth due to the increasing adoption of co-packaged optics solutions, which effectively manage high volumes of data traffic and reduce latency. These solutions improve bandwidth efficiency and optimize power consumption, making them vital for meeting the demands of modern computing and networking environments in data centers across the world.
The telecommunications and networking segment is anticipated to be the fastest-growing segment in the market from 2024 to 2029. The rising demand for high-speed optical connectivity solutions in telecommunications and networking is driving innovation and adoption of advanced technologies, such as co-packaged optics. As networks evolve to support faster data transfer rates, co-packaged optics manufacturing is essential for creating efficient and compact designs that optimize performance and reduce power consumption in modern networking systems. The integrated photonics with telecommunication facilitates seamless communication and significantly enhances overall network performance, making co-packaged optics a vital component of modern telecommunications infrastructure.
North America is analyzed to be the largest region in the global co-packaged optics market. Increased demand for cloud-based services, digitization, and data-intensive applications necessitates the utilization of more data. Co-packaged optics are the optimal solution for high-speed data transmission in data center facilities, which makes them an essential part of the modern technological ecosystem. Furthermore, the deployment of 5G networks, the expansion of broadband services across the region, and increasing mobile connectivity are all fuelling demand for fiber optics or co-packaged optics.
Asia Pacific is predicted to witness rapid growth during the forecast period. Co-packaged optics market trends suggest that Asia is catching up in terms of internet penetration, with East Asia having 73% and South Asia having only 39%, where demand for co-packaged optics is expected to grow. The region's increasing demand for data capacity in data centers will accelerate the development of optical modules from 800G to 1.6T speeds. Optoelectronic integration, low power consumption, and downsizing are all essential requirements for 1.6T optical modules driving the growth in the region.
Broadcom, Molex, Marvell, RANOVUS, Ragile Networks Inc., SENKO, Quanta Computer Inc., and Furukawa Electric Co., Ltd., among others, are some of the key players operating in the global co-packaged optics market.
Please note: This is not an exhaustive list of companies profiled in the report.
On April 21, 2024, MediaTek partnered with Ranovus to enter a niche market and expand into the heterogeneous integration co-packaged optics industry for a customized Application-Specific Integrated Circuit (ASIC) design platform for CPO. This platform is reported to provide advantages such as low cost, high bandwidth density, and low power consumption, expanding MediaTek’s presence in the thriving markets of AI, Machine Learning (ML), and High-Performance Computing (HPC).
On March 25, 2024, Marvell demonstrated industry’s first 200G 3D Silicon Photonics Engine, which is designed to enable higher density, lower power optical interconnects for next-generation ai clusters and cloud data centers.
1 STRATEGIC INSIGHTS ON NEW REVENUE POCKETS
1.1 Strategic Opportunity & Attractiveness Analysis
1.1.1 Hot Revenue Pockets
1.1.2 Market Attractiveness Score
1.1.3 Revenue Impacting Opportunity
1.1.4 High Growing Region/Country
1.1.5 Competitor Analysis
1.1.6 Consumer Analysis
1.2 Global Market Estimates' View
1.3 Strategic Insights across Business Functions
1.3.1 For Chief Executive Officers
1.3.2 For Chief Marketing Officers
1.3.3 For Chief Strategy Officers
1.4 Evaluate the Potential of your Existing Business Lines vs. New Lines to Enter Into
2 TECHNOLOGICAL TRENDS
2.1 Technological Adoption Rate
2.2 Current Trend Impact Analysis
2.3 Future Trend Impact Analysis
3 GLOBAL MARKET OUTLOOK
3.1 Market Pyramid Analysis
3.1.1 Introduction
3.1.2 Adjacent Market Opportunities
3.1.3 Ancillary Market Opportunities
3.2 Demand Side Analysis
3.2.1 Market Drivers: Impact Analysis
3.2.2 Market Restraints: Impact Analysis
3.2.3 Market Opportunities: Impact Analysis
3.2.4 Market Challenges: Impact Analysis
3.3 Supply Side Analysis
3.3.1 Porter’s Five Forces Analysis
3.3.1.1 Threat of New Entrants
3.3.1.2 Threat of New Substitutes
3.3.1.3 Bargaining Power of Suppliers
3.3.1.4 Bargaining Power of Buyers
3.3.1.5 Intensity of Competitive Rivalry
3.3.2 SWOT Analysis; By Factor (Political & Legal, Economic, and Technological)
3.3.2.1 Political Landscape
3.3.2.2 Economic Landscape
3.3.2.3 Social Landscape
3.3.2.4 Technology Landscape
3.3.3 Value Chain Analysis
3.3.4 Trend Analysis
3.3.5 Gap Analysis
3.3.6 Cost Analysis
4 GLOBAL CO-PACKAGED OPTICS MARKET, BY TYPE
4.1 Introduction
4.2 Co-Packaged Optics Market : Type Scope Key Takeaways
4.3 Revenue Growth Analysis, 2023 & 2029
4.4 CPO
4.4.1 CPO Market Estimates and Forecast, 2021-2029 (USD Million)
4.5 NPO
4.5.1 NPO Market Estimates and Forecast, 2021-2029 (USD Million)
5 GLOBAL CO-PACKAGED OPTICS MARKET, BY DATA RATES
5.1 Introduction
5.2 Co-Packaged Optics Market : Data Rates Scope Key Takeaways
5.3 Revenue Growth Analysis, 2023 & 2029
5.4 Less than 1.6 T & 1.6 T
5.4.1 Less than 1.6 T & 1.6 T Market Estimates and Forecast, 2021-2029 (USD Million)
5.5 3.2 T
5.5.1 3.2 T Market Estimates and Forecast, 2021-2029 (USD Million)
5.6 6.4 T
5.6.1 6.4 T Market Estimates and Forecast, 2021-2029 (USD Million)
6 GLOBAL CO-PACKAGED OPTICS MARKET, BY APPLICATION
6.1 Introduction
6.2 Co-Packaged Optics Market : Application Scope Key Takeaways
6.3 Revenue Growth Analysis, 2023 & 2029
6.4 Data Centers and High-performance Computing (HPC)
6.4.1 Data Centers and High-performance Computing (HPC) Market Estimates and Forecast, 2021-2029 (USD Million)
6.5 Telecommunications and Networking
6.5.1 Telecommunications and Networking Market Estimates and Forecast, 2021-2029 (USD Million)
6.6 Others
6.5.1 Others Market Estimates and Forecast, 2021-2029 (USD Million)
7 GLOBAL CO-PACKAGED OPTICS MARKET, BY REGION
7.1 Introduction
7.2 North America Co-Packaged Optics Market Estimates and Forecast, 2021-2029 (USD Million)
7.2.1 By Type
7.2.2 By Data Rates
7.2.3 By Application
7.2.4 By Country
7.2.4.1 U.S. Co-Packaged Optics Market Estimates and Forecast, 2021-2029 (USD Million)
7.2.4.1.1 By Type
7.2.4.1.2 By Data Rates
7.2.4.1.3 By Application
7.2.4.2 Canada Co-Packaged Optics Market Estimates and Forecast, 2021-2029 (USD Million)
7.2.4.2.1 By Type
7.2.4.2.2 By Data Rates
7.2.4.2.3 By Application
7.2.4.3 Mexico Co-Packaged Optics Market Estimates and Forecast, 2021-2029 (USD Million)
7.2.4.3.1 By Type
7.2.4.3.2 By Data Rates
7.2.4.3.3 By Application
7.3 Europe Co-Packaged Optics Market Estimates and Forecast, 2021-2029 (USD Million)
7.3.1 By Type
7.3.2 By Data Rates
7.3.3 By Application
7.3.4 By Country
7.3.4.1 Germany Co-Packaged Optics Market Estimates and Forecast, 2021-2029 (USD Million)
7.3.4.1.1 By Type
7.3.4.1.2 By Data Rates
7.3.4.1.3 By Application
7.3.4.2 U.K. Co-Packaged Optics Market Estimates and Forecast, 2021-2029 (USD Million)
7.3.4.2.1 By Type
7.3.4.2.2 By Data Rates
7.3.4.2.3 By Application
7.3.4.3 France Co-Packaged Optics Market Estimates and Forecast, 2021-2029 (USD Million)
7.3.4.3.1 By Type
7.3.4.3.2 By Data Rates
7.3.4.3.3 By Application
7.3.4.4 Italy Co-Packaged Optics Market Estimates and Forecast, 2021-2029 (USD Million)
7.3.4.4.1 By Type
7.3.4.4.2 By Data Rates
7.2.4.4.3 By Application
7.3.4.5 Spain Co-Packaged Optics Market Estimates and Forecast, 2021-2029 (USD Million)
7.3.4.5.1 By Type
7.3.4.5.2 By Data Rates
7.2.4.5.3 By Application
7.3.4.6 Netherlands Co-Packaged Optics Market Estimates and Forecast, 2021-2029 (USD Million)
7.3.4.6.1 By Type
7.3.4.6.2 By Data Rates
7.2.4.6.3 By Application
7.3.4.7 Rest of Europe Co-Packaged Optics Market Estimates and Forecast, 2021-2029 (USD Million)
7.3.4.7.1 By Type
7.3.4.7.2 By Data Rates
7.2.4.7.3 By Application
7.4 Asia Pacific Co-Packaged Optics Market Estimates and Forecast, 2021-2029 (USD Million)
7.4.1 By Type
7.4.2 By Data Rates
7.4.3 By Application
7.4.4 By Country
7.4.4.1 China Co-Packaged Optics Market Estimates and Forecast, 2021-2029 (USD Million)
7.4.4.1.1 By Type
7.4.4.1.2 By Data Rates
7.4.4.1.3 By Application
7.4.4.2 Japan Co-Packaged Optics Market Estimates and Forecast, 2021-2029 (USD Million)
7.4.4.2.1 By Type
7.4.4.2.2 By Data Rates
7.4.4.2.3 By Application
7.4.4.3 India Co-Packaged Optics Market Estimates and Forecast, 2021-2029 (USD Million)
7.4.4.3.1 By Type
7.4.4.3.2 By Data Rates
7.4.4.3.3 By Application
7.4.4.4 South Korea Co-Packaged Optics Market Estimates and Forecast, 2021-2029 (USD Million)
7.4.4.4.1 By Type
7.4.4.4.2 By Data Rates
7.4.4.4.3 By Application
7.4.4.5 Singapore Co-Packaged Optics Market Estimates and Forecast, 2021-2029 (USD Million)
7.4.4.5.1 By Type
7.4.4.5.2 By Data Rates
7.4.4.5.3 By Application
7.4.4.6 Malaysia Co-Packaged Optics Market Estimates and Forecast, 2021-2029 (USD Million)
7.4.4.6.1 By Type
7.4.4.6.2 By Data Rates
7.4.4.6.3 By Application
7.4.4.7 Thailand Co-Packaged Optics Market Estimates and Forecast, 2021-2029 (USD Million)
7.4.4.7.1 By Type
7.4.4.7.2 By Data Rates
7.4.4.7.3 By Application
7.4.4.8 Indonesia Co-Packaged Optics Market Estimates and Forecast, 2021-2029 (USD Million)
7.4.4.8.1 By Type
7.4.4.8.2 By Data Rates
7.4.4.8.3 By Application
7.4.4.9 Vietnam Co-Packaged Optics Market Estimates and Forecast, 2021-2029 (USD Million)
7.4.4.9.1 By Type
7.4.4.9.2 By Data Rates
7.4.4.9.3 By Application
7.4.4.10 Taiwan Co-Packaged Optics Market Estimates and Forecast, 2021-2029 (USD Million)
7.4.4.10.1 By Type
7.4.4.10.2 By Data Rates
7.4.4.10.3 By Application
7.4.4.11 Rest of Asia Pacific Co-Packaged Optics Market Estimates and Forecast, 2021-2029 (USD Million)
7.4.4.11.1 By Type
7.4.4.11.2 By Data Rates
7.4.4.11.3 By Application
7.5 Middle East and Africa Co-Packaged Optics Market Estimates and Forecast, 2021-2029 (USD Million)
7.5.1 By Type
7.5.2 By Data Rates
7.5.3 By Application
7.5.4 By Country
7.5.4.1 Saudi Arabia Co-Packaged Optics Market Estimates and Forecast, 2021-2029 (USD Million)
7.5.4.1.1 By Type
7.5.4.1.2 By Data Rates
7.5.4.1.3 By Application
7.5.4.2 U.A.E. Co-Packaged Optics Market Estimates and Forecast, 2021-2029 (USD Million)
7.5.4.2.1 By Type
7.5.4.2.2 By Data Rates
7.5.4.2.3 By Application
7.5.4.3 Israel Co-Packaged Optics Market Estimates and Forecast, 2021-2029 (USD Million)
7.5.4.3.1 By Type
7.5.4.3.2 By Data Rates
7.5.4.3.3 By Application
7.5.4.4 South Africa Co-Packaged Optics Market Estimates and Forecast, 2021-2029 (USD Million)
7.5.4.4.1 By Type
7.5.4.4.2 By Data Rates
7.5.4.4.3 By Application
7.5.4.5 Rest of Middle East and Africa Co-Packaged Optics Market Estimates and Forecast, 2021-2029 (USD Million)
7.5.4.5.1 By Type
7.5.4.5.2 By Data Rates
7.5.4.5.2 By Application
7.6 Central and South America Co-Packaged Optics Market Estimates and Forecast, 2021-2029 (USD Million)
7.6.1 By Type
7.6.2 By Data Rates
7.6.3 By Application
7.6.4 By Country
7.6.4.1 Brazil Co-Packaged Optics Market Estimates and Forecast, 2021-2029 (USD Million)
7.6.4.1.1 By Type
7.6.4.1.2 By Data Rates
7.6.4.1.3 By Application
7.6.4.2 Argentina Co-Packaged Optics Market Estimates and Forecast, 2021-2029 (USD Million)
7.6.4.2.1 By Type
7.6.4.2.2 By Data Rates
7.6.4.2.3 By Application
7.6.4.3 Chile Co-Packaged Optics Market Estimates and Forecast, 2021-2029 (USD Million)
7.6.4.3.1 By Type
7.6.4.3.2 By Data Rates
7.6.4.3.3 By Application
7.6.4.4 Rest of Central and South America Co-Packaged Optics Market Estimates and Forecast, 2021-2029 (USD Million)
7.6.4.4.1 By Type
7.6.4.4.2 By Data Rates
7.6.4.4.3 By Application
8 COMPETITIVE LANDCAPE
8.1 Company Market Share Analysis
8.2 Four Quadrant Positioning Matrix
8.2.1 Market Leaders
8.2.2 Market Visionaries
8.2.3 Market Challengers
8.2.4 Niche Market Players
8.3 Vendor Landscape
8.3.1 North America
8.3.2 Europe
8.3.3 Asia Pacific
8.3.4 Rest of the World
8.4 Company Profiles
8.4.1 Broadcom
8.4.1.1 Business Description & Financial Analysis
8.4.1.2 SWOT Analysis
8.4.1.3 Products & Services Offered
8.4.1.4 Strategic Alliances between Business Partners
8.4.2 Molex
8.4.2.1 Business Description & Financial Analysis
8.4.2.2 SWOT Analysis
8.4.2.3 Products & Services Offered
8.4.2.4 Strategic Alliances between Business Partners
8.4.3 Marvell
8.4.3.1 Business Description & Financial Analysis
8.4.3.2 SWOT Analysis
8.4.3.3 Products & Services Offered
8.4.3.4 Strategic Alliances between Business Partners
8.4.4 RANOVUS
8.4.4.1 Business Description & Financial Analysis
8.4.4.2 SWOT Analysis
8.4.4.3 Products & Services Offered
8.4.4.4 Strategic Alliances between Business Partners
8.4.5 Ragile Networks Inc.
8.4.5.1 Business Description & Financial Analysis
8.4.5.2 SWOT Analysis
8.4.5.3 Products & Services Offered
8.4.5.4 Strategic Alliances between Business Partners
8.4.6 SENKO
8.4.6.1 Business Description & Financial Analysis
8.4.6.2 SWOT Analysis
8.4.6.3 Products & Services Offered
8.4.6.4 Strategic Alliances between Business Partners
8.4.7 Quanta Computer Inc.
8.4.7.1 Business Description & Financial Analysis
8.4.7.2 SWOT Analysis
8.4.7.3 Products & Services Offered
8.4.7.4 Strategic Alliances between Business Partners
8.4.8 Furukawa Electric Co., Ltd.
8.4.8.1 Business Description & Financial Analysis
8.4.8.2 SWOT Analysis
8.4.8.3 Products & Services Offered
8.4.8.4 Strategic Alliances between Business Partners
8.4.9 Other Companies
8.4.9.1 Business Description & Financial Analysis
8.4.9.2 SWOT Analysis
8.4.9.3 Products & Services Offered
8.4.9.4 Strategic Alliances between Business Partners
9 RESEARCH METHODOLOGY
9.1 Market Introduction
9.1.1 Market Definition
9.1.2 Market Scope & Segmentation
9.2 Information Procurement
9.2.1 Secondary Research
9.2.1.1 Purchased Databases
9.2.1.2 GMEs Internal Data Repository
9.2.1.3 Secondary Resources & Third Party Perspectives
9.2.1.4 Company Information Sources
9.2.2 Primary Research
9.2.2.1 Various Types of Respondents for Primary Interviews
9.2.2.2 Number of Interviews Conducted throughout the Research Process
9.2.2.3 Primary Stakeholders
9.2.2.4 Discussion Guide for Primary Participants
9.2.3 Expert Panels
9.2.3.1 Expert Panels Across 30+ Industry
9.2.4 Paid Local Experts
9.2.4.1 Paid Local Experts Across 30+ Industry Across each Region
9.3 Market Estimation
9.3.1 Top-Down Approach
9.3.1.1 Macro-Economic Indicators Considered
9.3.1.2 Micro-Economic Indicators Considered
9.3.2 Bottom Up Approach
9.3.2.1 Company Share Analysis Approach
9.3.2.2 Estimation of Potential Product Sales
9.4 Data Triangulation
9.4.1 Data Collection
9.4.2 Time Series, Cross Sectional & Panel Data Analysis
9.4.3 Cluster Analysis
9.5 Analysis and Output
9.5.1 Inhouse AI Based Real Time Analytics Tool
9.5.2 Output From Desk & Primary Research
9.6 Research Assumptions & Limitations
9.7.1 Research Assumptions
9.7.2 Research Limitations
LIST OF TABLES
1 Global Co-Packaged Optics Market, By Type, 2021-2029 (USD Million)
2 CPO Market, By Region, 2021-2029 (USD Million)
3 NPO Market, By Region, 2021-2029 (USD Million)
4 Global Co-Packaged Optics Market, By Data Rates, 2021-2029 (USD Million)
5 Less than 1.6 T & 1.6 T Market, By Region, 2021-2029 (USD Million)
6 3.2 T Market, By Region, 2021-2029 (USD Million)
7 6.4 T Market, By Region, 2021-2029 (USD Million)
8 Global Co-Packaged Optics Market, By Application, 2021-2029 (USD Million)
9 Data Centers and High-performance Computing (HPC) Market, By Region, 2021-2029 (USD Million)
10 Telecommunications and Networking Market, By Region, 2021-2029 (USD Million)
11 Others Market, By Region, 2021-2029 (USD Million)
12 Regional Analysis, 2021-2029 (USD Million)
13 North America Co-Packaged Optics Market, By Type, 2021-2029 (USD Million)
14 North America Co-Packaged Optics Market, By Data Rates, 2021-2029 (USD Million)
15 North America Co-Packaged Optics Market, By Application, 2021-2029 (USD Million)
16 North America Co-Packaged Optics Market, By Country, 2021-2029 (USD Million)
17 U.S. Co-Packaged Optics Market, By Type, 2021-2029 (USD Million)
18 U.S. Co-Packaged Optics Market, By Data Rates, 2021-2029 (USD Million)
19 U.S. Co-Packaged Optics Market, By Application, 2021-2029 (USD Million)
20 Canada Co-Packaged Optics Market, By Type, 2021-2029 (USD Million)
21 Canada Co-Packaged Optics Market, By Data Rates, 2021-2029 (USD Million)
22 Canada Co-Packaged Optics Market, By Application, 2021-2029 (USD Million)
23 Mexico Co-Packaged Optics Market, By Type, 2021-2029 (USD Million)
24 Mexico Co-Packaged Optics Market, By Data Rates, 2021-2029 (USD Million)
25 Mexico Co-Packaged Optics Market, By Application, 2021-2029 (USD Million)
26 Europe Co-Packaged Optics Market, By Type, 2021-2029 (USD Million)
27 Europe Co-Packaged Optics Market, By Data Rates, 2021-2029 (USD Million)
28 Europe Co-Packaged Optics Market, By Application, 2021-2029 (USD Million)
29 Europe Co-Packaged Optics Market, By COUNTRY, 2021-2029 (USD Million)
30 Germany Co-Packaged Optics Market, By Type, 2021-2029 (USD Million)
31 Germany Co-Packaged Optics Market, By Data Rates, 2021-2029 (USD Million)
32 Germany Co-Packaged Optics Market, By Application, 2021-2029 (USD Million)
33 U.K. Co-Packaged Optics Market, By Type, 2021-2029 (USD Million)
34 U.K. Co-Packaged Optics Market, By Data Rates, 2021-2029 (USD Million)
35 U.K. Co-Packaged Optics Market, By Application, 2021-2029 (USD Million)
36 France Co-Packaged Optics Market, By Type, 2021-2029 (USD Million)
37 France Co-Packaged Optics Market, By Data Rates, 2021-2029 (USD Million)
38 France Co-Packaged Optics Market, By Application, 2021-2029 (USD Million)
39 Italy Co-Packaged Optics Market, By Type, 2021-2029 (USD Million)
40 Italy Co-Packaged Optics Market, By End Use , 2021-2029 (USD Million)
41 Italy Co-Packaged Optics Market, By Application, 2021-2029 (USD Million)
42 Spain Co-Packaged Optics Market, By Type, 2021-2029 (USD Million)
43 Spain Co-Packaged Optics Market, By Data Rates, 2021-2029 (USD Million)
44 Spain Co-Packaged Optics Market, By Application, 2021-2029 (USD Million)
45 Rest Of Europe Co-Packaged Optics Market, By Type, 2021-2029 (USD Million)
46 Rest Of Europe Co-Packaged Optics Market, By Data Rates, 2021-2029 (USD Million)
47 Rest of Europe Co-Packaged Optics Market, By Application, 2021-2029 (USD Million)
48 Asia Pacific Co-Packaged Optics Market, By Type, 2021-2029 (USD Million)
49 Asia Pacific Co-Packaged Optics Market, By Data Rates, 2021-2029 (USD Million)
50 Asia Pacific Co-Packaged Optics Market, By Application, 2021-2029 (USD Million)
51 Asia Pacific Co-Packaged Optics Market, By Country, 2021-2029 (USD Million)
52 China Co-Packaged Optics Market, By Type, 2021-2029 (USD Million)
53 China Co-Packaged Optics Market, By Data Rates, 2021-2029 (USD Million)
54 China Co-Packaged Optics Market, By Application, 2021-2029 (USD Million)
55 India Co-Packaged Optics Market, By Type, 2021-2029 (USD Million)
56 India Co-Packaged Optics Market, By Data Rates, 2021-2029 (USD Million)
57 India Co-Packaged Optics Market, By Application, 2021-2029 (USD Million)
58 Japan Co-Packaged Optics Market, By Type, 2021-2029 (USD Million)
59 Japan Co-Packaged Optics Market, By Data Rates, 2021-2029 (USD Million)
60 Japan Co-Packaged Optics Market, By Application, 2021-2029 (USD Million)
61 South Korea Co-Packaged Optics Market, By Type, 2021-2029 (USD Million)
62 South Korea Co-Packaged Optics Market, By Data Rates, 2021-2029 (USD Million)
63 South Korea Co-Packaged Optics Market, By Application, 2021-2029 (USD Million)
64 Singapore Co-Packaged Optics Market, By Type, 2021-2029 (USD Million)
65 Singapore Co-Packaged Optics Market, By Data Rates, 2021-2029 (USD Million)
66 Singapore Co-Packaged Optics Market, By Application, 2021-2029 (USD Million)
67 Malaysia Co-Packaged Optics Market, By Type, 2021-2029 (USD Million)
68 Malaysia Co-Packaged Optics Market, By Data Rates, 2021-2029 (USD Million)
69 Malaysia Co-Packaged Optics Market, By Application, 2021-2029 (USD Million)
70 Thailand Co-Packaged Optics Market, By Type, 2021-2029 (USD Million)
71 Thailand Co-Packaged Optics Market, By Data Rates, 2021-2029 (USD Million)
72 Thailand Co-Packaged Optics Market, By Application, 2021-2029 (USD Million)
73 Indonesia Co-Packaged Optics Market, By Type, 2021-2029 (USD Million)
74 Indonesia Co-Packaged Optics Market, By Data Rates, 2021-2029 (USD Million)
75 Indonesia Co-Packaged Optics Market, By Application, 2021-2029 (USD Million)
76 Vietnam Co-Packaged Optics Market, By Type, 2021-2029 (USD Million)
77 Vietnam Co-Packaged Optics Market, By Data Rates, 2021-2029 (USD Million)
78 Vietnam Co-Packaged Optics Market, By Application, 2021-2029 (USD Million)
79 Taiwan Co-Packaged Optics Market, By Type, 2021-2029 (USD Million)
80 Taiwan Co-Packaged Optics Market, By Data Rates, 2021-2029 (USD Million)
81 Taiwan Co-Packaged Optics Market, By Application, 2021-2029 (USD Million)
82 Rest of Asia Pacific Co-Packaged Optics Market, By Type, 2021-2029 (USD Million)
83 Rest of Asia Pacific Co-Packaged Optics Market, By Data Rates, 2021-2029 (USD Million)
84 Rest of Asia Pacific Co-Packaged Optics Market, By Application, 2021-2029 (USD Million)
85 Middle East and Africa Co-Packaged Optics Market, By Type, 2021-2029 (USD Million)
86 Middle East and Africa Co-Packaged Optics Market, By Data Rates, 2021-2029 (USD Million)
87 Middle East and Africa Co-Packaged Optics Market, By Application, 2021-2029 (USD Million)
88 Middle East and Africa Co-Packaged Optics Market, By Country, 2021-2029 (USD Million)
89 Saudi Arabia Co-Packaged Optics Market, By Type, 2021-2029 (USD Million)
90 Saudi Arabia Co-Packaged Optics Market, By Data Rates, 2021-2029 (USD Million)
91 Saudi Arabia Co-Packaged Optics Market, By Application, 2021-2029 (USD Million)
92 UAE Co-Packaged Optics Market, By Type, 2021-2029 (USD Million)
93 UAE Co-Packaged Optics Market, By Data Rates, 2021-2029 (USD Million)
94 UAE Co-Packaged Optics Market, By Application, 2021-2029 (USD Million)
95 Israel Co-Packaged Optics Market, By Type, 2021-2029 (USD Million)
96 Israel Co-Packaged Optics Market, By Data Rates, 2021-2029 (USD Million)
97 Israel Co-Packaged Optics Market, By Application, 2021-2029 (USD Million)
98 South Africa Co-Packaged Optics Market, By Type, 2021-2029 (USD Million)
99 South Africa Co-Packaged Optics Market, By Data Rates, 2021-2029 (USD Million)
100 South Africa Co-Packaged Optics Market, By Application, 2021-2029 (USD Million)
101 Rest of Middle East and Africa Co-Packaged Optics Market, By Type, 2021-2029 (USD Million)
102 Rest of Middle East and Africa Co-Packaged Optics Market, By Data Rates, 2021-2029 (USD Million)
103 Rest of Middle East and Africa Co-Packaged Optics Market, By Application, 2021-2029 (USD Million)
104 Central and South America Co-Packaged Optics Market, By Type, 2021-2029 (USD Million)
105 Central and South America Co-Packaged Optics Market, By Data Rates, 2021-2029 (USD Million)
106 Central and South America Co-Packaged Optics Market, By Application, 2021-2029 (USD Million)
107 Central and South America Co-Packaged Optics Market, By Country, 2021-2029 (USD Million)
108 Brazil Co-Packaged Optics Market, By Type, 2021-2029 (USD Million)
109 Brazil Co-Packaged Optics Market, By Data Rates, 2021-2029 (USD Million)
110 Brazil Co-Packaged Optics Market, By Application, 2021-2029 (USD Million)
111 Argentina Co-Packaged Optics Market, By Type, 2021-2029 (USD Million)
112 Argentina Co-Packaged Optics Market, By Data Rates, 2021-2029 (USD Million)
113 Argentina Co-Packaged Optics Market, By Application, 2021-2029 (USD Million)
114 Chile Co-Packaged Optics Market, By Type, 2021-2029 (USD Million)
115 Chile Co-Packaged Optics Market, By Data Rates, 2021-2029 (USD Million)
116 Chile Co-Packaged Optics Market, By Application, 2021-2029 (USD Million)
117 Rest of Central and South America Co-Packaged Optics Market, By Type, 2021-2029 (USD Million)
118 Rest of Central and South America Co-Packaged Optics Market, By Data Rates, 2021-2029 (USD Million)
119 Rest of Central and South America Co-Packaged Optics Market, By Application, 2021-2029 (USD Million)
120 Broadcom: Products & Services Offerin
121 Molex: Products & Services Offering
122 Marvell: Products & Services Offering
123 RANOVUS: Products & Services Offering
124 Ragile Networks Inc.: Products & Services Offering
125 SENKO: Products & Services Offering
126 Quanta Computer Inc. : Products & Services Offering
127 Furukawa Electric Co., Ltd., Inc: Products & Services Offering
LIST OF FIGURES
1 Global Co-Packaged Optics Market Overview
2 Global Co-Packaged Optics Market Value From 2021-2029 (USD Million)
3 Global Co-Packaged Optics Market Share, By Type (2023)
4 Global Co-Packaged Optics Market Share, By Data Rates (2023)
5 Global Co-Packaged Optics Market Share, By Application (2023)
6 Global Co-Packaged Optics Market, By Region (Asia Pacific Market)
7 Technological Trends In Global Co-Packaged Optics Market
8 Four Quadrant Competitor Positioning Matrix
9 Impact Of Macro & Micro Indicators On The Market
10 Impact Of Key Drivers On The Global Co-Packaged Optics Market
11 Impact Of Challenges On The Global Co-Packaged Optics Market
12 Porter’s Five Forces Analysis
13 Global Co-Packaged Optics Market: By Type Scope Key Takeaways
14 Global Co-Packaged Optics Market, By Type Segment: Revenue Growth Analysis
15 CPO Market, By Region, 2021-2029 (USD Million)
16 NPO Market, By Region, 2021-2029 (USD Million)
17 Global Co-Packaged Optics Market: By Data Rates Scope Key Takeaways
18 Global Co-Packaged Optics Market, By Data Rates Segment: Revenue Growth Analysis
19 Less than 1.6 T & 1.6 T Market, By Region, 2021-2029 (USD Million)
20 3.2 T Market, By Region, 2021-2029 (USD Million)
21 6.4 T Market, By Region, 2021-2029 (USD Million)
22 Global Co-Packaged Optics Market: By Application Scope Key Takeaways
23 Global Co-Packaged Optics Market, By Application Segment: Revenue Growth Analysis
24 Data Centers and High-performance Computing (HPC) Market, By Region, 2021-2029 (USD Million)
25 Telecommunications and Networking Market, By Region, 2021-2029 (USD Million)
26 Others Market, By Region, 2021-2029 (USD Million)
27 Regional Segment: Revenue Growth Analysis
28 Global Co-Packaged Optics Market: Regional Analysis
29 North America Co-Packaged Optics Market Overview
30 North America Co-Packaged Optics Market, By Type
31 North America Co-Packaged Optics Market, By Data Rates
32 North America Co-Packaged Optics Market, By Application
33 North America Co-Packaged Optics Market, By Country
34 U.S. Co-Packaged Optics Market, By Type
35 U.S. Co-Packaged Optics Market, By Data Rates
36 U.S. Co-Packaged Optics Market, By Application
37 Canada Co-Packaged Optics Market, By Type
38 Canada Co-Packaged Optics Market, By Data Rates
39 Canada Co-Packaged Optics Market, By Application
40 Mexico Co-Packaged Optics Market, By Type
41 Mexico Co-Packaged Optics Market, By Data Rates
42 Mexico Co-Packaged Optics Market, By Application
43 Four Quadrant Positioning Matrix
44 Company Market Share Analysis
45 Broadcom: Company Snapshot
46 Broadcom: SWOT Analysis
47 Broadcom: Geographic Presence
48 Molex: Company Snapshot
49 Molex: SWOT Analysis
50 Molex: Geographic Presence
51 Marvell: Company Snapshot
52 Marvell: SWOT Analysis
53 Marvell: Geographic Presence
54 RANOVUS: Company Snapshot
55 RANOVUS: Swot Analysis
56 RANOVUS: Geographic Presence
57 Ragile Networks Inc.: Company Snapshot
58 Ragile Networks Inc.: SWOT Analysis
59 Ragile Networks Inc.: Geographic Presence
60 SENKO: Company Snapshot
61 SENKO: SWOT Analysis
62 SENKO: Geographic Presence
63 Quanta Computer Inc. : Company Snapshot
64 Quanta Computer Inc. : SWOT Analysis
65 Quanta Computer Inc. : Geographic Presence
66 Furukawa Electric Co., Ltd., Inc.: Company Snapshot
67 Furukawa Electric Co., Ltd., Inc.: SWOT Analysis
68 Furukawa Electric Co., Ltd., Inc.: Geographic Presence
The Global Co-Packaged Optics Market has been studied from the year 2019 till 2029. However, the CAGR provided in the report is from the year 2024 to 2029. The research methodology involved three stages: Desk research, Primary research, and Analysis & Output from the entire research process.

The desk research involved a robust background study which meant referring to paid and unpaid databases to understand the market dynamics; mapping contracts from press releases; identifying the key players in the market, studying their product portfolio, competition level, annual reports/SEC filings & investor presentations; and learning the demand and supply-side analysis for the Co-Packaged Optics Market.

The primary research activity included telephonic conversations with more than 50 tier 1 industry consultants, distributors, and end-use product manufacturers.

Finally, based on the above thorough research process, an in-depth analysis was carried out considering the following aspects: market attractiveness, current & future market trends, market share analysis, SWOT analysis of the company and customer analytics.

Frequently Asked Questions

This FREE sample includes market data points, ranging from trend analyses to market estimates & forecasts. See for yourself.
Or view our licence options:
Tailor made solutions just for you
80% of our clients seek made-to-order reports. How do you want us to tailor yours?
OUR CLIENTS


