This report was recently updated on April 14 2025 with the latest and most recent
market numbers
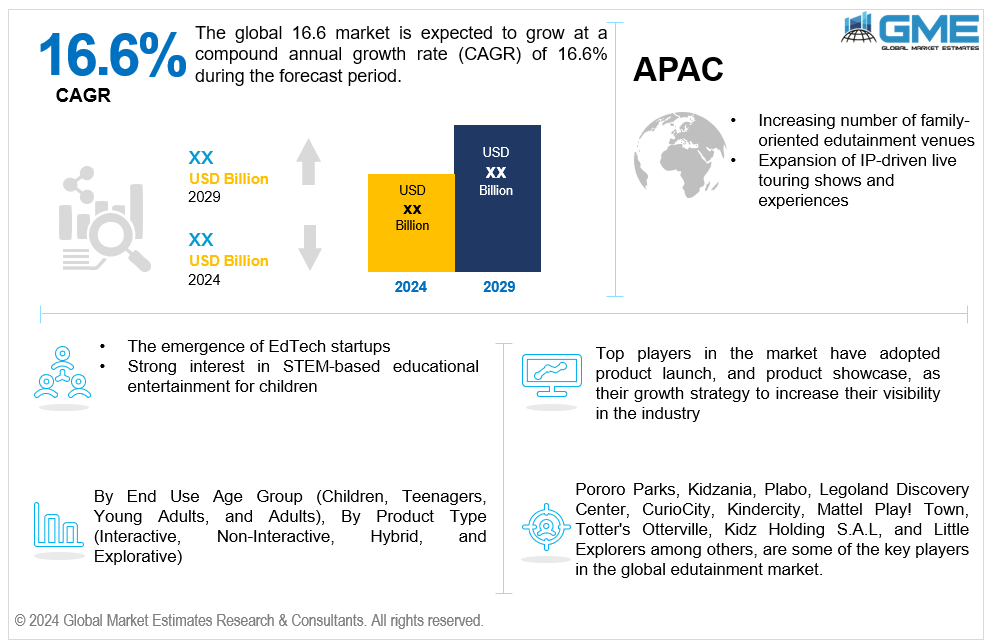
Global Edutainment Market Size, Trends & Analysis - Forecasts to 2029 By End Use Age Group (Children, Teenagers, Young Adults, and Adults), By Product Type (Interactive, Non-Interactive, Hybrid, and Explorative), and By Region (North America, Asia Pacific, Central and South America, Europe, and Middle East and Africa), Competitive Landscape, Company Market Share Analysis, and End User Analysis
The global edutainment market is estimated to exhibit a CAGR of 16.6% from 2024 to 2029.
The primary factors propelling the market growth are the increasing number of family-oriented edutainment venues and the expansion of IP-driven live touring shows and experiences. Family-oriented edutainment venues, such as KidZania and Legoland Discovery Centers, offer immersive experiences that combine educational content with entertainment. By providing interactive role-playing activities and hands-on exhibits, these venues engage both children and families in learning while having fun. For example, KidZania allows children to explore various professions in a miniature city, teaching them about different careers while imparting essential life skills like financial literacy and social responsibility. The success of such venues lies in their ability to meet the educational aspirations of parents while simultaneously catering to the entertainment needs of children. This dual appeal makes them a popular choice for family outings and school excursions, contributing significantly to the growth of the edutainment market.
The emergence of EdTech startups along with the strong interest in STEM-based educational entertainment for children are expected to support the market growth. Virtual reality (VR), augmented reality (AR), and artificial intelligence (AI) are just a few of the cutting-edge technologies that EdTech companies use to create captivating learning experiences for audiences, particularly young adults and children. By offering innovative platforms and apps, EdTech startups make learning more accessible, interactive, and personalized, catering to various educational needs across subjects like STEM, language arts, and social sciences. The pandemic accelerated the adoption of digital learning, prompting many EdTech companies to create hybrid models that combine live experiences with digital content. The combination of entertainment and technology not only increases the instructional value but also broadens the market appeal, drawing in educators and families.
Growing partnerships between entertainment companies and entertainment brands coupled with government initiatives supporting educational content in entertainment propel market growth. These collaborations blend the expertise of educational institutions with the creative and technological prowess of entertainment companies, resulting in highly engaging and educational experiences. For instance, partnerships between popular media franchises and educational organizations lead to the development of themed exhibits, interactive learning apps, and live shows that are both entertaining and informative. These joint ventures attract larger audiences by leveraging well-known characters and narratives to make learning more relatable and enjoyable for children and families.
However, high initial investment and lack of infrastructure and accessibility hamper the market growth.
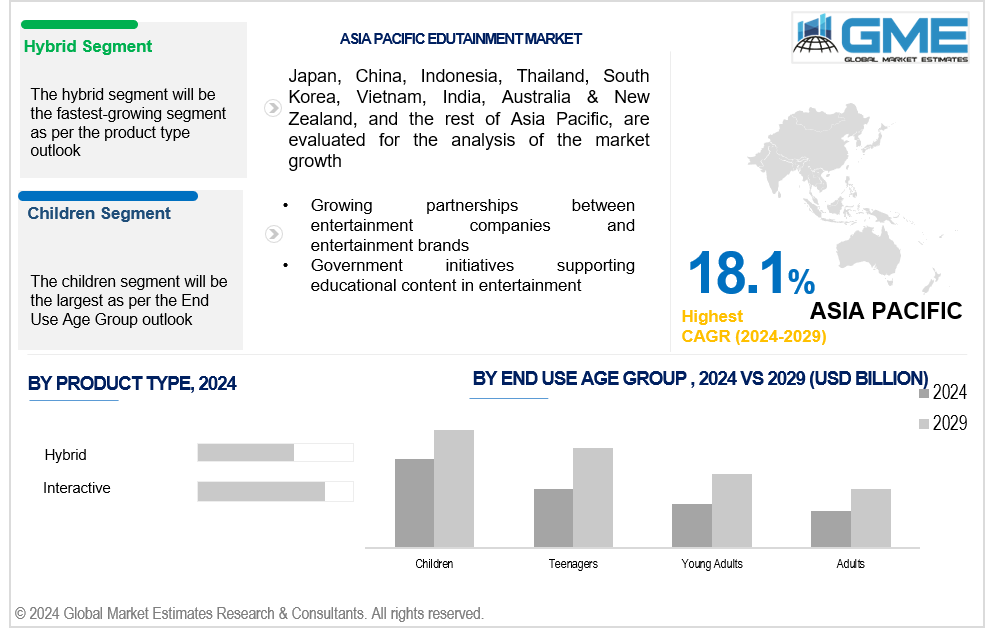
The children segment is expected to hold the largest share of the market over the forecast period. The growing integration of technology in early education has made digital learning tools more accessible and engaging for young learners. Interactive and gamified educational content appeals particularly to children, capturing their attention and enhancing their learning experience.
The teenagers segment is expected to be the fastest-growing segment in the market from 2024 to 2029. This is due to their increasing engagement with digital platforms and interactive content. This segment is highly tech-savvy, and drawn to immersive experiences like virtual reality, gamified learning, and interactive apps that combine education with entertainment. Teenagers also represent a critical audience for STEM-related edutainment, aligning with their educational journeys
The interactive segment is expected to hold the largest share of the market over the forecast period. Interactive analogs, such as smart toys, augmented reality (AR) books, and hybrid learning kits, provide a hands-on, immersive learning experience that engages multiple senses, making education more effective and enjoyable. This segment benefits from advancements in AR and virtual reality (VR) technologies, which enhance traditional learning materials with interactive elements, bringing educational content to life.
The hybrid segment is anticipated to be the fastest-growing segment in the market from 2024 to 2029. Hybrid combines both physical and digital experiences, offering greater flexibility and engagement. This approach caters to diverse audience preferences by blending interactive, on-site attractions with digital content that can be accessed remotely. The hybrid model allows for a seamless learning experience across platforms, appealing to users who seek immersive and convenient educational entertainment.
North America is expected to be the largest region in the global market. The region's growth is driven by a strong focus on digital innovation and the integration of educational content with entertainment. The region benefits from substantial government investments in educational technology, as well as the widespread adoption of digital learning platforms. North America's tech-savvy population and high internet penetration rates contribute to the rising demand for interactive and immersive learning experiences, particularly among younger audiences.
Asia Pacific is anticipated to witness rapid growth during the forecast period. Countries like China, India, and Japan are witnessing a surge in demand for educational entertainment, particularly as parents seek out engaging and enriching activities for their children. The region's strong focus on technology adoption, including the integration of AR and VR in educational settings, is transforming the way learning is experienced.
Pororo Parks, Kidzania, Plabo, Legoland Discovery Center, CurioCity, Kindercity, Mattel Play! Town, Totter's Otterville, Kidz Holding S.A.L, and Little Explorers among others, are some of the key players in the global edutainment market.
Please note: This is not an exhaustive list of companies profiled in the report.
In May 2023, StoryToys and Marvel Entertainment collaborated on the release of the 'Marvel HQ' app. This app, designed for children aged 4 to 7, offers a range of developmentally appropriate games, stories, and interactive content featuring Marvel characters.
In January 2023, the U.S. Department of Education announced funding grants to Twin Cities Public Television and the Corporation for Public Broadcasting to develop digital media and television content aimed at preschoolers and early elementary students.
1 STRATEGIC INSIGHTS ON NEW REVENUE POCKETS
1.1 Strategic Opportunity & Attractiveness Analysis
1.1.1 Hot Revenue Pockets
1.1.2 Market Attractiveness Score
1.1.3 Revenue Impacting Opportunity
1.1.4 High Growing Region/Country
1.1.5 Competitor Analysis
1.1.6 Consumer Analysis
1.2 Global Market Estimates' View
1.3 Strategic Insights across Business Functions
1.3.1 For Chief Executive Officers
1.3.2 For Chief Marketing Officers
1.3.3 For Chief Strategy Officers
1.4 Evaluate the Potential of your Existing Business Lines vs. New Lines to Enter Into
2 TECHNOLOGICAL TRENDS
2.1 Technological Adoption Rate
2.2 Current Trend Impact Analysis
2.3 Future Trend Impact Analysis
3 GLOBAL GREEN ENERGY MOBILITY MARKET OUTLOOK
3.1 Market Pyramid Analysis
3.1.1 Introduction
3.1.2 Adjacent Market Opportunities
3.1.3 Ancillary Market Opportunities
3.2 Demand Side Analysis
3.2.1 Market Drivers: Impact Analysis
3.2.2 Market Restraints: Impact Analysis
3.2.3 Market Opportunities: Impact Analysis
3.2.4 Market Challenges: Impact Analysis
3.3 Supply Side Analysis
3.3.1 Porter’s Five Forces Analysis
3.3.1.1 Threat of New Entrants
3.3.1.2 Threat of New Substitutes
3.3.1.3 Bargaining Power of Suppliers
3.3.1.4 Bargaining Power of Buyers
3.3.1.5 Intensity of Competitive Rivalry
3.3.2 SWOT Analysis; By Factor (Political & Legal, Economic, and Technological)
3.3.2.1 Political Landscape
3.3.2.2 Economic Landscape
3.3.2.3 Social Landscape
3.3.2.4 Technology Landscape
3.3.3 Value Chain Analysis
3.3.4 Trend Analysis
3.3.5 Gap Analysis
3.3.6 Cost Analysis
4 GLOBAL GREEN ENERGY MOBILITY MARKET, BY TYPE
4.1 Introduction
4.2 Green Energy Mobility Market: Type Scope Key Takeaways
4.3 Revenue Growth Analysis, 2023 & 2029
4.4 Electric Mobility
4.4.1 Electric Mobility Market Estimates and Forecast, 2021-2029 (USD Million)
4.5 Battery Electric Vehicle
4.5.1 Battery Electric Vehicle Market Estimates and Forecast, 2021-2029 (USD Million)
4.6 Hybrid Electric Vehicle
4.6.1 Hybrid Electric Vehicle Market Estimates and Forecast, 2021-2029 (USD Million)
4.7 Fuel Cell Electric Vehicle
4.7.1 Fuel Cell Electric Vehicle Market Estimates and Forecast, 2021-2029 (USD Million)
4.8 Plug-in Hybrid Electric Vehicle
4.8.1 Plug-in Hybrid Electric Vehicle Market Estimates and Forecast, 2021-2029 (USD Million)
4.9 Gas Mobility
4.9.1 Gas Mobility Market Estimates and Forecast, 2021-2029 (USD Million)
4.10 Others
4.10.1 Others Market Estimates and Forecast, 2021-2029 (USD Million)
5 GLOBAL GREEN ENERGY MOBILITY MARKET, BY VEHICLE TYPE
5.1 Introduction
5.2 Green Energy Mobility Market: Vehicle Type Scope Key Takeaways
5.3 Revenue Growth Analysis, 2023 & 2029
5.4 Commercial Vehicles
5.4.1 Commercial Vehicles Market Estimates and Forecast, 2021-2029 (USD Million)
5.5 Medium & Heavy Commercial Vehicles
5.5.1 Medium & Heavy Commercial Vehicles Market Estimates and Forecast, 2021-2029 (USD Million)
5.6 Passengers Vehicles
5.6.1 Passengers Vehicles Market Estimates and Forecast, 2021-2029 (USD Million)
5.7 Light Commercial Vehicles
5.7.1 Light Commercial Vehicles Market Estimates and Forecast, 2021-2029 (USD Million)
5.8 Two & Three Wheelers
5.8.1 Two & Three Wheelers Market Estimates and Forecast, 2021-2029 (USD Million)
5.9 E-Scooters
5.9.1 E-Scooters Market Estimates and Forecast, 2021-2029 (USD Million)
5.10 E-Bikes
5.10.1 E-Bikes Market Estimates and Forecast, 2021-2029 (USD Million)
5.11 Others
5.11.1 Others Market Estimates and Forecast, 2021-2029 (USD Million)
6 GLOBAL GREEN ENERGY MOBILITY MARKET, BY APPLICATION
6.1 Introduction
6.2 Green Energy Mobility Market: Application Scope Key Takeaways
6.3 Revenue Growth Analysis, 2023 & 2029
6.4 Urban Logistics
6.4.1 Urban Logistics Market Estimates and Forecast, 2021-2029 (USD Million)
6.5 Mass Transit Infrastructure
6.5.1 Mass Transit Infrastructure Market Estimates and Forecast, 2021-2029 (USD Million)
6.6 Others
6.6.1 Others Market Estimates and Forecast, 2021-2029 (USD Million)
7 GLOBAL GREEN ENERGY MOBILITY MARKET, BY REGION
7.1 Introduction
7.2 North America Green Energy Mobility Market Estimates and Forecast, 2021-2029 (USD Million)
7.2.1 By Type
7.2.2 By Vehicle Type
7.2.3 By Application
7.2.4 By Country
7.2.4.1 U.S. Green Energy Mobility Market Estimates and Forecast, 2021-2029 (USD Million)
7.2.4.1.1 By Type
7.2.4.1.2 By Vehicle Type
7.2.4.1.3 By Application
7.2.4.2 Canada Green Energy Mobility Market Estimates and Forecast, 2021-2029 (USD Million)
7.2.4.2.1 By Type
7.2.4.2.2 By Vehicle Type
7.2.4.2.3 By Application
7.2.4.3 Mexico Green Energy Mobility Market Estimates and Forecast, 2021-2029 (USD Million)
7.2.4.3.1 By Type
7.2.4.3.2 By Vehicle Type
7.2.4.3.3 By Application
7.3 Europe Green Energy Mobility Market Estimates and Forecast, 2021-2029 (USD Million)
7.3.1 By Type
7.3.2 By Vehicle Type
7.3.3 By Application
7.3.4 By Country
7.3.4.1 Germany Green Energy Mobility Market Estimates and Forecast, 2021-2029 (USD Million)
7.3.4.1.1 By Type
7.3.4.1.2 By Vehicle Type
7.3.4.1.3 By Application
7.3.4.2 U.K. Green Energy Mobility Market Estimates and Forecast, 2021-2029 (USD Million)
7.3.4.2.1 By Type
7.3.4.2.2 By Vehicle Type
7.3.4.2.3 By Application
7.3.4.3 France Green Energy Mobility Market Estimates and Forecast, 2021-2029 (USD Million)
7.3.4.3.1 By Type
7.3.4.3.2 By Vehicle Type
7.3.4.3.3 By Application
7.3.4.4 Italy Green Energy Mobility Market Estimates and Forecast, 2021-2029 (USD Million)
7.3.4.4.1 By Type
7.3.4.4.2 By Vehicle Type
7.2.4.4.3 By Application
7.3.4.5 Spain Green Energy Mobility Market Estimates and Forecast, 2021-2029 (USD Million)
7.3.4.5.1 By Type
7.3.4.5.2 By Vehicle Type
7.2.4.5.3 By Application
7.3.4.6 Netherlands Green Energy Mobility Market Estimates and Forecast, 2021-2029 (USD Million)
7.3.4.6.1 By Type
7.3.4.6.2 By Vehicle Type
7.2.4.6.3 By Application
7.3.4.7 Rest of Europe Green Energy Mobility Market Estimates and Forecast, 2021-2029 (USD Million)
7.3.4.7.1 By Type
7.3.4.7.2 By Vehicle Type
7.2.4.7.3 By Application
7.4 Asia Pacific Green Energy Mobility Market Estimates and Forecast, 2021-2029 (USD Million)
7.4.1 By Type
7.4.2 By Vehicle Type
7.4.3 By Application
7.4.4 By Country
7.4.4.1 China Green Energy Mobility Market Estimates and Forecast, 2021-2029 (USD Million)
7.4.4.1.1 By Type
7.4.4.1.2 By Vehicle Type
7.4.4.1.3 By Application
7.4.4.2 Japan Green Energy Mobility Market Estimates and Forecast, 2021-2029 (USD Million)
7.4.4.2.1 By Type
7.4.4.2.2 By Vehicle Type
7.4.4.2.3 By Application
7.4.4.3 India Green Energy Mobility Market Estimates and Forecast, 2021-2029 (USD Million)
7.4.4.3.1 By Type
7.4.4.3.2 By Vehicle Type
7.4.4.3.3 By Application
7.4.4.4 South Korea Green Energy Mobility Market Estimates and Forecast, 2021-2029 (USD Million)
7.4.4.4.1 By Type
7.4.4.4.2 By Vehicle Type
7.4.4.4.3 By Application
7.4.4.5 Singapore Green Energy Mobility Market Estimates and Forecast, 2021-2029 (USD Million)
7.4.4.5.1 By Type
7.4.4.5.2 By Vehicle Type
7.4.4.5.3 By Application
7.4.4.6 Malaysia Green Energy Mobility Market Estimates and Forecast, 2021-2029 (USD Million)
7.4.4.6.1 By Type
7.4.4.6.2 By Vehicle Type
7.4.4.6.3 By Application
7.4.4.7 Thailand Green Energy Mobility Market Estimates and Forecast, 2021-2029 (USD Million)
7.4.4.7.1 By Type
7.4.4.7.2 By Vehicle Type
7.4.4.7.3 By Application
7.4.4.8 Indonesia Green Energy Mobility Market Estimates and Forecast, 2021-2029 (USD Million)
7.4.4.8.1 By Type
7.4.4.8.2 By Vehicle Type
7.4.4.8.3 By Application
7.4.4.9 Vietnam Green Energy Mobility Market Estimates and Forecast, 2021-2029 (USD Million)
7.4.4.9.1 By Type
7.4.4.9.2 By Vehicle Type
7.4.4.9.3 By Application
7.4.4.10 Taiwan Green Energy Mobility Market Estimates and Forecast, 2021-2029 (USD Million)
7.4.4.10.1 By Type
7.4.4.10.2 By Vehicle Type
7.4.4.10.3 By Application
7.4.4.11 Rest of Asia Pacific Green Energy Mobility Market Estimates and Forecast, 2021-2029 (USD Million)
7.4.4.11.1 By Type
7.4.4.11.2 By Vehicle Type
7.4.4.11.3 By Application
7.5 Middle East and Africa Green Energy Mobility Market Estimates and Forecast, 2021-2029 (USD Million)
7.5.1 By Type
7.5.2 By Vehicle Type
7.5.3 By Application
7.5.4 By Country
7.5.4.1 Saudi Arabia Green Energy Mobility Market Estimates and Forecast, 2021-2029 (USD Million)
7.5.4.1.1 By Type
7.5.4.1.2 By Vehicle Type
7.5.4.1.3 By Application
7.5.4.2 U.A.E. Green Energy Mobility Market Estimates and Forecast, 2021-2029 (USD Million)
7.5.4.2.1 By Type
7.5.4.2.2 By Vehicle Type
7.5.4.2.3 By Application
7.5.4.3 Israel Green Energy Mobility Market Estimates and Forecast, 2021-2029 (USD Million)
7.5.4.3.1 By Type
7.5.4.3.2 By Vehicle Type
7.5.4.3.3 By Application
7.5.4.4 South Africa Green Energy Mobility Market Estimates and Forecast, 2021-2029 (USD Million)
7.5.4.4.1 By Type
7.5.4.4.2 By Vehicle Type
7.5.4.4.3 By Application
7.5.4.5 Rest of Middle East and Africa Green Energy Mobility Market Estimates and Forecast, 2021-2029 (USD Million)
7.5.4.5.1 By Type
7.5.4.5.2 By Vehicle Type
7.5.4.5.2 By Application
7.6 Central and South America Green Energy Mobility Market Estimates and Forecast, 2021-2029 (USD Million)
7.6.1 By Type
7.6.2 By Vehicle Type
7.6.3 By Application
7.6.4 By Country
7.6.4.1 Brazil Green Energy Mobility Market Estimates and Forecast, 2021-2029 (USD Million)
7.6.4.1.1 By Type
7.6.4.1.2 By Vehicle Type
7.6.4.1.3 By Application
7.6.4.2 Argentina Green Energy Mobility Estimates and Forecast, 2021-2029 (USD Million)
7.6.4.2.1 By Type
7.6.4.2.2 By Vehicle Type
7.6.4.2.3 By Application
7.6.4.3 Chile Green Energy Mobility Market Estimates and Forecast, 2021-2029 (USD Million)
7.6.4.3.1 By Type
7.6.4.3.2 By Vehicle Type
7.6.4.3.3 By Application
7.6.4.4 Rest of Central and South America Green Energy Mobility Market Estimates and Forecast, 2021-2029 (USD Million)
7.6.4.4.1 By Type
7.6.4.4.2 By Vehicle Type
7.6.4.4.3 By Application
8 COMPETITIVE LANDCAPE
8.1 Company Market Share Analysis
8.2 Four Quadrant Positioning Matrix
8.2.1 Market Leaders
8.2.2 Market Visionaries
8.2.3 Market Challengers
8.2.4 Niche Market Players
8.3 Vendor Landscape
8.3.1 North America
8.3.2 Europe
8.3.3 Asia Pacific
8.3.4 Rest of the World
8.4 Company Profiles
8.4.1 BMW
8.4.1.1 Business Description & Financial Analysis
8.4.1.2 SWOT Analysis
8.4.1.3 Products & Services Offered
8.4.1.4 Strategic Alliances between Business Partners
8.4.2 BYD
8.4.2.1 Business Description & Financial Analysis
8.4.2.2 SWOT Analysis
8.4.2.3 Products & Services Offered
8.4.2.4 Strategic Alliances between Business Partners
8.4.3 Tesla
8.4.3.1 Business Description & Financial Analysis
8.4.3.2 SWOT Analysis
8.4.3.3 Products & Services Offered
8.4.3.4 Strategic Alliances between Business Partners
8.4.4 Daimler AG
8.4.4.1 Business Description & Financial Analysis
8.4.4.2 SWOT Analysis
8.4.4.3 Products & Services Offered
8.4.4.4 Strategic Alliances between Business Partners
8.4.5 Nissan
8.4.5.1 Business Description & Financial Analysis
8.4.5.2 SWOT Analysis
8.4.5.3 Products & Services Offered
8.4.5.4 Strategic Alliances between Business Partners
8.4.6 Engie
8.4.6.1 Business Description & Financial Analysis
8.4.6.2 SWOT Analysis
8.4.6.3 Products & Services Offered
8.4.6.4 Strategic Alliances between Business Partners
8.4.7 Ford Motors Company
8.4.7.1 Business Description & Financial Analysis
8.4.7.2 SWOT Analysis
8.4.7.3 Products & Services Offered
8.4.8.4 Strategic Alliances between Business Partners
8.4.8 Kia Motors Corp.
8.4.8.1 Business Description & Financial Analysis
8.4.8.2 SWOT Analysis
8.4.8.3 Products & Services Offered
8.4.8.4 Strategic Alliances between Business Partners
8.4.9 General Motors
8.4.9.1 Business Description & Financial Analysis
8.4.9.2 SWOT Analysis
8.4.9.3 Products & Services Offered
8.4.9.4 Strategic Alliances between Business Partners
8.4.10 Volkswagen
8.4.10.1 Business Description & Financial Analysis
8.4.10.2 SWOT Analysis
8.4.10.3 Products & Services Offered
8.4.10.4 Strategic Alliances between Business Partners
8.4.11 Hyundai Motor Company
8.4.11.1 Business Description & Financial Analysis
8.4.11.2 SWOT Analysis
8.4.11.3 Products & Services Offered
8.4.11.4 Strategic Alliances between Business Partners
8.4.12 Maruti
8.4.12.1 Business Description & Financial Analysis
8.4.12.2 SWOT Analysis
8.4.12.3 Products & Services Offered
8.4.12.4 Strategic Alliances between Business Partners
8.4.13 TATA Motors Limited
8.4.13.1 Business Description & Financial Analysis
8.4.13.2 SWOT Analysis
8.4.13.3 Products & Services Offered
8.4.13.4 Strategic Alliances between Business Partners
8.4.14 Toyota
8.4.14.1 Business Description & Financial Analysis
8.4.14.2 SWOT Analysis
8.4.14.3 Products & Services Offered
8.4.14.4 Strategic Alliances between Business Partners
8.4.15 Hero Electric Vehicles Pvt. Ltd.
8.4.15.1 Business Description & Financial Analysis
8.4.15.2 SWOT Analysis
8.4.15.3 Products & Services Offered
8.4.15.4 Strategic Alliances between Business Partners
8.4.16 Volvo Car Corp.
8.4.16.1 Business Description & Financial Analysis
8.4.16.2 SWOT Analysis
8.4.16.3 Products & Services Offered
8.4.16.4 Strategic Alliances between Business Partners
8.4.17 Greaves Electric Mobility Private Limited (‘GEMPL’)
8.4.17.1 Business Description & Financial Analysis
8.4.17.2 SWOT Analysis
8.4.17.3 Products & Services Offered
8.4.17.4 Strategic Alliances between Business Partners
8.4.18 Ather Energy Private Limited
8.4.18.1 Business Description & Financial Analysis
8.4.18.2 SWOT Analysis
8.4.18.3 Products & Services Offered
8.4.18.4 Strategic Alliances between Business Partners
8.4.19 ATUL Auto Limited
8.4.19.1 Business Description & Financial Analysis
8.4.19.2 SWOT Analysis
8.4.19.3 Products & Services Offered
8.4.19.4 Strategic Alliances between Business Partners
8.4.20 Bajaj Auto Limited
8.4.20.1 Business Description & Financial Analysis
8.4.20.2 SWOT Analysis
8.4.20.3 Products & Services Offered
8.4.20.4 Strategic Alliances between Business Partners
8.4.21 Other Companies
8.4.21.1 Business Description & Financial Analysis
8.4.21.2 SWOT Analysis
8.4.21.3 Products & Services Offered
8.4.21.4 Strategic Alliances between Business Partners
9 RESEARCH METHODOLOGY
9.1 Market Introduction
9.1.1 Market Definition
9.1.2 Market Scope & Segmentation
9.2 Information Procurement
9.2.1 Secondary Research
9.2.1.1 Purchased Databases
9.2.1.2 GMEs Internal Data Repository
9.2.1.3 Secondary Resources & Third Party Perspectives
9.2.1.4 Company Information Sources
9.2.2 Primary Research
9.2.2.1 Various Types of Respondents for Primary Interviews
9.2.2.2 Number of Interviews Conducted throughout the Research Process
9.2.2.3 Primary Stakeholders
9.2.2.4 Discussion Guide for Primary Participants
9.2.3 Expert Panels
9.2.3.1 Expert Panels Across 30+ Industry
9.2.4 Paid Local Experts
9.2.4.1 Paid Local Experts Across 30+ Industry Across each Region
9.3 Market Estimation
9.3.1 Top-Down Approach
9.3.1.1 Macro-Economic Indicators Considered
9.3.1.2 Micro-Economic Indicators Considered
9.3.2 Bottom Up Approach
9.3.2.1 Company Share Analysis Approach
9.3.2.2 Estimation of Potential Product Sales
9.4 Data Triangulation
9.4.1 Data Collection
9.4.2 Time Series, Cross Sectional & Panel Data Analysis
9.4.3 Cluster Analysis
9.5 Analysis and Output
9.5.1 Inhouse AI Based Real Time Analytics Tool
9.5.2 Output From Desk & Primary Research
9.6 Research Assumptions & Limitations
9.7.1 Research Assumptions
9.7.2 Research Limitations
LIST OF TABLES
1 Global Green Energy Mobility Market, By Type, 2021-2029 (USD Mllion)
2 Electric Mobility Market, By Region, 2021-2029 (USD Mllion)
3 Battery Electric Vehicle Market, By Region, 2021-2029 (USD Mllion)
4 Hybrid Electric Vehicle Market, By Region, 2021-2029 (USD Mllion)
5 Fuel Cell Electric Vehicle Market, By Region, 2021-2029 (USD Mllion)
6 Plug-in Hybrid Electric Vehicle Market, By Region, 2021-2029 (USD Mllion)
7 Gas Mobility Market, By Region, 2021-2029 (USD Mllion)
8 Others Market, By Region, 2021-2029 (USD Mllion)
9 Global Green Energy Mobility Market, By Vehicle Type, 2021-2029 (USD Mllion)
10 Commercial Vehicles Market, By Region, 2021-2029 (USD Mllion)
11 Medium & Heavy Commercial Vehicles Market, By Region, 2021-2029 (USD Mllion)
12 Light Commercial Vehicles Market, By Region, 2021-2029 (USD Mllion)
13 Passengers Vehicles Market, By Region, 2021-2029 (USD Mllion)
14 Two & Three Wheelers Market, By Region, 2021-2029 (USD Mllion)
15 E-Scooters Market, By Region, 2021-2029 (USD Mllion)
16 E-Bikes Market, By Region, 2021-2029 (USD Mllion)
17 Others Market, By Region, 2021-2029 (USD Mllion)
18 Global Green Energy Mobility Market, By Application, 2021-2029 (USD Mllion)
19 Urban Logistics Market, By Region, 2021-2029 (USD Mllion)
20 Mass Transit Infrastructure Market, By Region, 2021-2029 (USD Mllion)
21 Others Market, By Region, 2021-2029 (USD Mllion)
22 Regional Analysis, 2021-2029 (USD Mllion)
23 North America Green Energy Mobility Market, By Type, 2021-2029 (USD Million)
24 North America Green Energy Mobility Market, By Vehicle Type, 2021-2029 (USD Million)
25 North America Green Energy Mobility Market, By Application, 2021-2029 (USD Million)
26 North America Green Energy Mobility Market, By Country, 2021-2029 (USD Million)
27 U.S Green Energy Mobility Market, By Type, 2021-2029 (USD Million)
28 U.S Green Energy Mobility Market, By Vehicle Type, 2021-2029 (USD Million)
29 U.S Green Energy Mobility Market, By Application, 2021-2029 (USD Million)
30 Canada Green Energy Mobility Market, By Type, 2021-2029 (USD Million)
31 Canada Green Energy Mobility Market, By Vehicle Type, 2021-2029 (USD Million)
32 Canada Green Energy Mobility Market, By Application, 2021-2029 (USD Million)
33 Mexico Green Energy Mobility Market, By Type, 2021-2029 (USD Million)
34 Mexico Green Energy Mobility Market, By Vehicle Type, 2021-2029 (USD Million)
35 Mexico Green Energy Mobility Market, By Application, 2021-2029 (USD Million)
36 Europe Green Energy Mobility Market, By Type, 2021-2029 (USD Million)
37 Europe Green Energy Mobility Market, By Vehicle Type, 2021-2029 (USD Million)
38 Europe Green Energy Mobility Market, By Application, 2021-2029 (USD Million)
39 Europe Green Energy Mobility Market, By COUNTRY, 2021-2029 (USD Million)
40 Germany Green Energy Mobility Market, By Type, 2021-2029 (USD Million)
41 Germany Green Energy Mobility Market, By Vehicle Type, 2021-2029 (USD Million)
42 Germany Green Energy Mobility Market, By Application, 2021-2029 (USD Million)
43 U.K Green Energy Mobility Market, By Type, 2021-2029 (USD Million)
44 U.K Green Energy Mobility Market, By Vehicle Type, 2021-2029 (USD Million)
45 U.K Green Energy Mobility Market, By Application, 2021-2029 (USD Million)
46 France Green Energy Mobility Market, By Type, 2021-2029 (USD Million)
47 France Green Energy Mobility Market, By Vehicle Type, 2021-2029 (USD Million)
48 France Green Energy Mobility Market, By Application, 2021-2029 (USD Million)
49 Italy Green Energy Mobility Market, By Type, 2021-2029 (USD Million)
50 Italy Green Energy Mobility Market, By End Use , 2021-2029 (USD Million)
51 Italy Green Energy Mobility Market, By Application, 2021-2029 (USD Million)
52 Spain Green Energy Mobility Market, By Type, 2021-2029 (USD Million)
53 Spain Green Energy Mobility Market, By Vehicle Type, 2021-2029 (USD Million)
54 Spain Green Energy Mobility Market, By Application, 2021-2029 (USD Million)
55 Rest Of Europe Green Energy Mobility Market, By Type, 2021-2029 (USD Million)
56 Rest Of Europe Green Energy Mobility Market, By Vehicle Type, 2021-2029 (USD Million)
57 Rest of Europe Green Energy Mobility Market, By Application, 2021-2029 (USD Million)
58 Asia Pacific Green Energy Mobility Market, By Type, 2021-2029 (USD Million)
59 Asia Pacific Green Energy Mobility Market, By Vehicle Type, 2021-2029 (USD Million)
60 Asia Pacific Green Energy Mobility Market, By Application, 2021-2029 (USD Million)
61 Asia Pacific Green Energy Mobility Market, By Country, 2021-2029 (USD Million)
62 China Green Energy Mobility Market, By Type, 2021-2029 (USD Million)
63 China Green Energy Mobility Market, By Vehicle Type, 2021-2029 (USD Million)
64 China Green Energy Mobility Market, By Application, 2021-2029 (USD Million)
65 India Green Energy Mobility Market, By Type, 2021-2029 (USD Million)
66 India Green Energy Mobility Market, By Vehicle Type, 2021-2029 (USD Million)
67 India Green Energy Mobility Market, By Application, 2021-2029 (USD Million)
68 Japan Green Energy Mobility Market, By Type, 2021-2029 (USD Million)
69 Japan Green Energy Mobility Market, By Vehicle Type, 2021-2029 (USD Million)
70 Japan Green Energy Mobility Market, By Application, 2021-2029 (USD Million)
71 South Korea Green Energy Mobility Market, By Type, 2021-2029 (USD Million)
72 South Korea Green Energy Mobility Market, By Vehicle Type, 2021-2029 (USD Million)
73 South Korea Green Energy Mobility Market, By Application, 2021-2029 (USD Million)
74 Singapore Green Energy Mobility Market, By Type, 2021-2029 (USD Million)
75 Singapore Green Energy Mobility Market, By Vehicle Type, 2021-2029 (USD Million)
76 Singapore Green Energy Mobility Market, By Application, 2021-2029 (USD Million)
77 Malaysia Green Energy Mobility Market, By Type, 2021-2029 (USD Million)
78 Malaysia Green Energy Mobility Market, By Vehicle Type, 2021-2029 (USD Million)
79 Malaysia Green Energy Mobility Market, By Application, 2021-2029 (USD Million)
80 Thailand Green Energy Mobility Market, By Type, 2021-2029 (USD Million)
81 Thailand Green Energy Mobility Market, By Vehicle Type, 2021-2029 (USD Million)
82 Thailand Green Energy Mobility Market, By Application, 2021-2029 (USD Million)
83 Indonesia Green Energy Mobility Market, By Type, 2021-2029 (USD Million)
84 Indonesia Green Energy Mobility Market, By Vehicle Type, 2021-2029 (USD Million)
85 Indonesia Green Energy Mobility Market, By Application, 2021-2029 (USD Million)
86 Vietnam Green Energy Mobility Market, By Type, 2021-2029 (USD Million)
87 Vietnam Green Energy Mobility Market, By Vehicle Type, 2021-2029 (USD Million)
88 Vietnam Green Energy Mobility Market, By Application, 2021-2029 (USD Million)
89 Taiwan Green Energy Mobility Market, By Type, 2021-2029 (USD Million)
90 Taiwan Green Energy Mobility Market, By Vehicle Type, 2021-2029 (USD Million)
91 Taiwan Green Energy Mobility Market, By Application, 2021-2029 (USD Million)
92 Rest of Asia Pacific Green Energy Mobility Market, By Type, 2021-2029 (USD Million)
93 Rest of Asia Pacific Green Energy Mobility Market, By Vehicle Type, 2021-2029 (USD Million)
94 Rest of Asia Pacific Green Energy Mobility Market, By Application, 2021-2029 (USD Million)
95 Middle East and Africa Green Energy Mobility Market, By Type, 2021-2029 (USD Million)
96 Middle East and Africa Green Energy Mobility Market, By Vehicle Type, 2021-2029 (USD Million)
97 Middle East and Africa Green Energy Mobility Market, By Application, 2021-2029 (USD Million)
98 Middle East and Africa Green Energy Mobility Market, By Country, 2021-2029 (USD Million)
99 Saudi Arabia Green Energy Mobility Market, By Type, 2021-2029 (USD Million)
100 Saudi Arabia Green Energy Mobility Market, By Vehicle Type, 2021-2029 (USD Million)
101 Saudi Arabia Green Energy Mobility Market, By Application, 2021-2029 (USD Million)
102 UAE Green Energy Mobility Market, By Type, 2021-2029 (USD Million)
103 UAE Green Energy Mobility Market, By Vehicle Type, 2021-2029 (USD Million)
104 UAE Green Energy Mobility Market, By Application, 2021-2029 (USD Million)
105 Israel Green Energy Mobility Market, By Type, 2021-2029 (USD Million)
106 Israel Green Energy Mobility Market, By Vehicle Type, 2021-2029 (USD Million)
107 Israel Green Energy Mobility Market, By Application, 2021-2029 (USD Million)
108 South Africa Green Energy Mobility Market, By Type, 2021-2029 (USD Million)
109 South Africa Green Energy Mobility Market, By Vehicle Type, 2021-2029 (USD Million)
110 South Africa Green Energy Mobility Market, By Application, 2021-2029 (USD Million)
111 Rest of Middle East and Africa Green Energy Mobility Market, By Type, 2021-2029 (USD Million)
112 Rest of Middle East and Africa Green Energy Mobility Market, By Vehicle Type, 2021-2029 (USD Million)
113 Rest of Middle East and Africa Green Energy Mobility Market, By Application, 2021-2029 (USD Million)
114 Central and South America Green Energy Mobility Market, By Type, 2021-2029 (USD Million)
115 Central and South America Green Energy Mobility Market, By Vehicle Type, 2021-2029 (USD Million)
116 Central and South America Green Energy Mobility Market, By Application, 2021-2029 (USD Million)
117 Central and South America Green Energy Mobility Market, By Country, 2021-2029 (USD Million)
118 Brazil Green Energy Mobility Market, By Type, 2021-2029 (USD Million)
119 Brazil Green Energy Mobility Market, By Vehicle Type, 2021-2029 (USD Million)
120 Brazil Green Energy Mobility Market, By Application, 2021-2029 (USD Million)
121 Argentina Green Energy Mobility Market, By Type, 2021-2029 (USD Million)
122 Argentina Green Energy Mobility Market, By Vehicle Type, 2021-2029 (USD Million)
123 Argentina Green Energy Mobility Market, By Application, 2021-2029 (USD Million)
124 Chile Green Energy Mobility Market, By Type, 2021-2029 (USD Million)
125 Chile Green Energy Mobility Market, By Vehicle Type, 2021-2029 (USD Million)
126 Chile Green Energy Mobility Market, By Application, 2021-2029 (USD Million)
127 Rest of Central and South America Green Energy Mobility Market, By Type, 2021-2029 (USD Million)
128 Rest of Central and South America Green Energy Mobility Market, By Vehicle Type, 2021-2029 (USD Million)
129 Rest of Central and South America Green Energy Mobility Market, By Application, 2021-2029 (USD Million)
130 BMW: Products & Services Offering
131 BYD: Products & Services Offering
132 Tesla: Products & Services Offering
133 Daimler AG: Products & Services Offering
134 Nissan: Products & Services Offering
135 ENGIE: Products & Services Offering
136 Ford Motors Company : Products & Services Offering
137 Kia Motors Corp.: Products & Services Offering
138 General Motors, Inc: Products & Services Offering
139 Volkswagen: Products & Services Offering
140 Hyundai Motor Company: Products & Services Offering
141 Maruti: Products & Services Offering
142 TATA Motors Limited: Products & Services Offering
143 Toyota: Products & Services Offering
144 Volvo Car Corp.: Products & Services Offering
145 Greaves Electric Mobility Private Limited (‘GEMPL’): Products & Services Offering
146 Ather Energy Private Limited: Products & Services Offering
147 ATUL Auto Limited: Products & Services Offering
148 Bajaj Auto Limited: Products & Services Offering
149 Hero Electric Vehicles Pvt. Ltd.: Products & Services Offering
150 Other Companies: Products & Services Offering
LIST OF FIGURES
1 Global Green Energy Mobility Market Overview
2 Global Green Energy Mobility Market Value From 2021-2029 (USD Mllion)
3 Global Green Energy Mobility Market Share, By Type (2022)
4 Global Green Energy Mobility Market Share, By Vehicle Type (2022)
5 Global Green Energy Mobility Market Share, By Application (2022)
6 Global Green Energy Mobility Market, By Region (Asia Pacific Market)
7 Technological Trends In Global Green Energy Mobility Market
8 Four Quadrant Competitor Positioning Matrix
9 Impact Of Macro & Micro Indicators On The Market
10 Impact Of Key Drivers On The Global Green Energy Mobility Market
11 Impact Of Challenges On The Global Green Energy Mobility Market
12 Porter’s Five Forces Analysis
13 Global Green Energy Mobility Market: By Type Scope Key Takeaways
14 Global Green Energy Mobility Market, By Type Segment: Revenue Growth Analysis
15 Electric Mobility Market, By Region, 2021-2029 (USD Mllion)
16 Battery Electric Vehicle Market, By Region, 2021-2029 (USD Mllion)
17 Hybrid Electric Vehicle Market, By Region, 2021-2029 (USD Mllion)
18 Fuel Cell Electric Vehicle Market, By Region, 2021-2029 (USD Mllion)
19 Plug-in Hybrid Electric Vehicle Market, By Region, 2021-2029 (USD Mllion)
20 Gas Mobility, Market, By Region, 2021-2029 (USD Mllion)
21 Others Market, By Region, 2021-2029 (USD Mllion)
22 Global Green Energy Mobility Market: By Vehicle Type Scope Key Takeaways
23 Global Green Energy Mobility Market, By Vehicle Type Segment: Revenue Growth Analysis
24 Commercial Vehicles Market, By Region, 2021-2029 (USD Mllion)
25 Medium & Heavy Commercial Vehicles Market, By Region, 2021-2029 (USD Mllion)
26 Light Commercial Vehicles Market, By Region, 2021-2029 (USD Mllion)
27 Passengers VehiclesMarket, By Region, 2021-2029 (USD Mllion)
28 Two & Three Wheelers Market, By Region, 2021-2029 (USD Mllion)
29 E-Scooters Market, By Region, 2021-2029 (USD Mllion)
30 E-Bikes Market, By Region, 2021-2029 (USD Mllion)
31 Others Market, By Region, 2021-2029 (USD Mllion)
32 Global Green Energy Mobility Market: By Application Scope Key Takeaways
33 Global Green Energy Mobility Market, By Application Segment: Revenue Growth Analysis
34 Urban Logistics Market, By Region, 2021-2029 (USD Mllion)
35 Mass Transit Infrastructure Market, By Region, 2021-2029 (USD Mllion)
36 Regional Segment: Revenue Growth Analysis
37 Global Green Energy Mobility Market: Regional Analysis
38 North America Green Energy Mobility Market Overview
39 North America Green Energy Mobility Market, By Type
40 North America Green Energy Mobility Market, By Vehicle Type
41 North America Green Energy Mobility Market, By Application
42 North America Green Energy Mobility Market, By Country
43 U.S. Green Energy Mobility Market, By Type
44 U.S. Green Energy Mobility Market, By Vehicle Type
45 U.S. Green Energy Mobility Market, By Application
46 Canada Green Energy Mobility Market, By Type
47 Canada Green Energy Mobility Market, By Vehicle Type
48 Canada Green Energy Mobility Market, By Application
49 Mexico Green Energy Mobility Market, By Type
50 Mexico Green Energy Mobility Market, By Vehicle Type
51 Mexico Green Energy Mobility Market, By Application
52 Four Quadrant Positioning Matrix
53 Company Market Share Analysis
54 BMW: Company Snapshot
55 BMW: SWOT Analysis
56 BMW: Geographic Presence
57 BYD: Company Snapshot
58 BYD: SWOT Analysis
59 BYD: Geographic Presence
60 Tesla: Company Snapshot
61 Tesla: SWOT Analysis
62 Tesla: Geographic Presence
63 Daimler AG: Company Snapshot
64 Daimler AG: Swot Analysis
65 Daimler AG: Geographic Presence
66 Nissan: Company Snapshot
67 Nissan: SWOT Analysis
68 Nissan: Geographic Presence
69 Engie: Company Snapshot
70 Engie: SWOT Analysis
71 Engie: Geographic Presence
72 Ford Motors Company : Company Snapshot
73 Ford Motors Company : SWOT Analysis
74 Ford Motors Company : Geographic Presence
75 Kia Motors Corp.: Company Snapshot
76 Kia Motors Corp.: SWOT Analysis
77 Kia Motors Corp.: Geographic Presence
78 General Motors, Inc.: Company Snapshot
79 General Motors, Inc.: SWOT Analysis
80 General Motors, Inc.: Geographic Presence
81 Volkswagen: Company Snapshot
82 Volkswagen: SWOT Analysis
83 Volkswagen: Geographic Presence
84 Hyundai Motor Company: Company Snapshot
85 Hyundai Motor Company: SWOT Analysis
86 Hyundai Motor Company: Geographic Presence
87 Maruti: Company Snapshot
88 Maruti: SWOT Analysis
89 Maruti: Geographic Presence
90 TATA Motors Limited: Company Snapshot
91 TATA Motors Limited: SWOT Analysis
92 TATA Motors Limited: Geographic Presence
93 Toyota: Company Snapshot
94 Toyota: SWOT Analysis
95 Toyota: Geographic Presence
96 Volvo Car Corp.: Company Snapshot
97 Volvo Car Corp.: SWOT Analysis
98 Volvo Car Corp.: Geographic Presence
99 Greaves Electric Mobility Private Limited (‘GEMPL’): Company Snapshot
100 Greaves Electric Mobility Private Limited (‘GEMPL’): SWOT Analysis
101 Greaves Electric Mobility Private Limited (‘GEMPL’): Geographic Presence
102 Ather Energy Private Limited: Company Snapshot
103 Ather Energy Private Limited: SWOT Analysis
104 Ather Energy Private Limited: Geographic Presence
105 ATUL Auto Limited: Company Snapshot
106 ATUL Auto Limited: SWOT Analysis
107 ATUL Auto Limited: Geographic Presence
108 Bajaj Auto Limited: Company Snapshot
109 Bajaj Auto Limited: SWOT Analysis
110 Bajaj Auto Limited: Geographic Presence
111 Hero Electric Vehicles Pvt. Ltd.: Company Snapshot
112 Hero Electric Vehicles Pvt. Ltd.: SWOT Analysis
113 Hero Electric Vehicles Pvt. Ltd.: Geographic Presence
114 Other Companies: Company Snapshot
115 Other Companies: SWOT Analysis
116 Other Companies: Geographic Presence
The Global Edutainment Market has been studied from the year 2019 till 2029. However, the CAGR provided in the report is from the year 2024 to 2029. The research methodology involved three stages: Desk research, Primary research, and Analysis & Output from the entire research process.

The desk research involved a robust background study which meant referring to paid and unpaid databases to understand the market dynamics; mapping contracts from press releases; identifying the key players in the market, studying their product portfolio, competition level, annual reports/SEC filings & investor presentations; and learning the demand and supply-side analysis for the Edutainment Market.

The primary research activity included telephonic conversations with more than 50 tier 1 industry consultants, distributors, and end-use product manufacturers.

Finally, based on the above thorough research process, an in-depth analysis was carried out considering the following aspects: market attractiveness, current & future market trends, market share analysis, SWOT analysis of the company and customer analytics.

Frequently Asked Questions

This FREE sample includes market data points, ranging from trend analyses to market estimates & forecasts. See for yourself.
Or view our licence options:
Tailor made solutions just for you
80% of our clients seek made-to-order reports. How do you want us to tailor yours?
OUR CLIENTS


