This report was recently updated on April 14 2025 with the latest and most recent
market numbers
Global Inventory Tags Market Size, Trends & Analysis - Forecasts to 2029 By End User (Retail, Industrial, Logistics, and Others), By Technology (Barcodes, RFID, and Others), By Label Type (Plastic, Paper, Metal, and Others), and By Region (North America, Asia Pacific, Central and South America, Europe, and Middle East and Africa), Competitive Landscape, Company Market Share Analysis, and End User Analysis
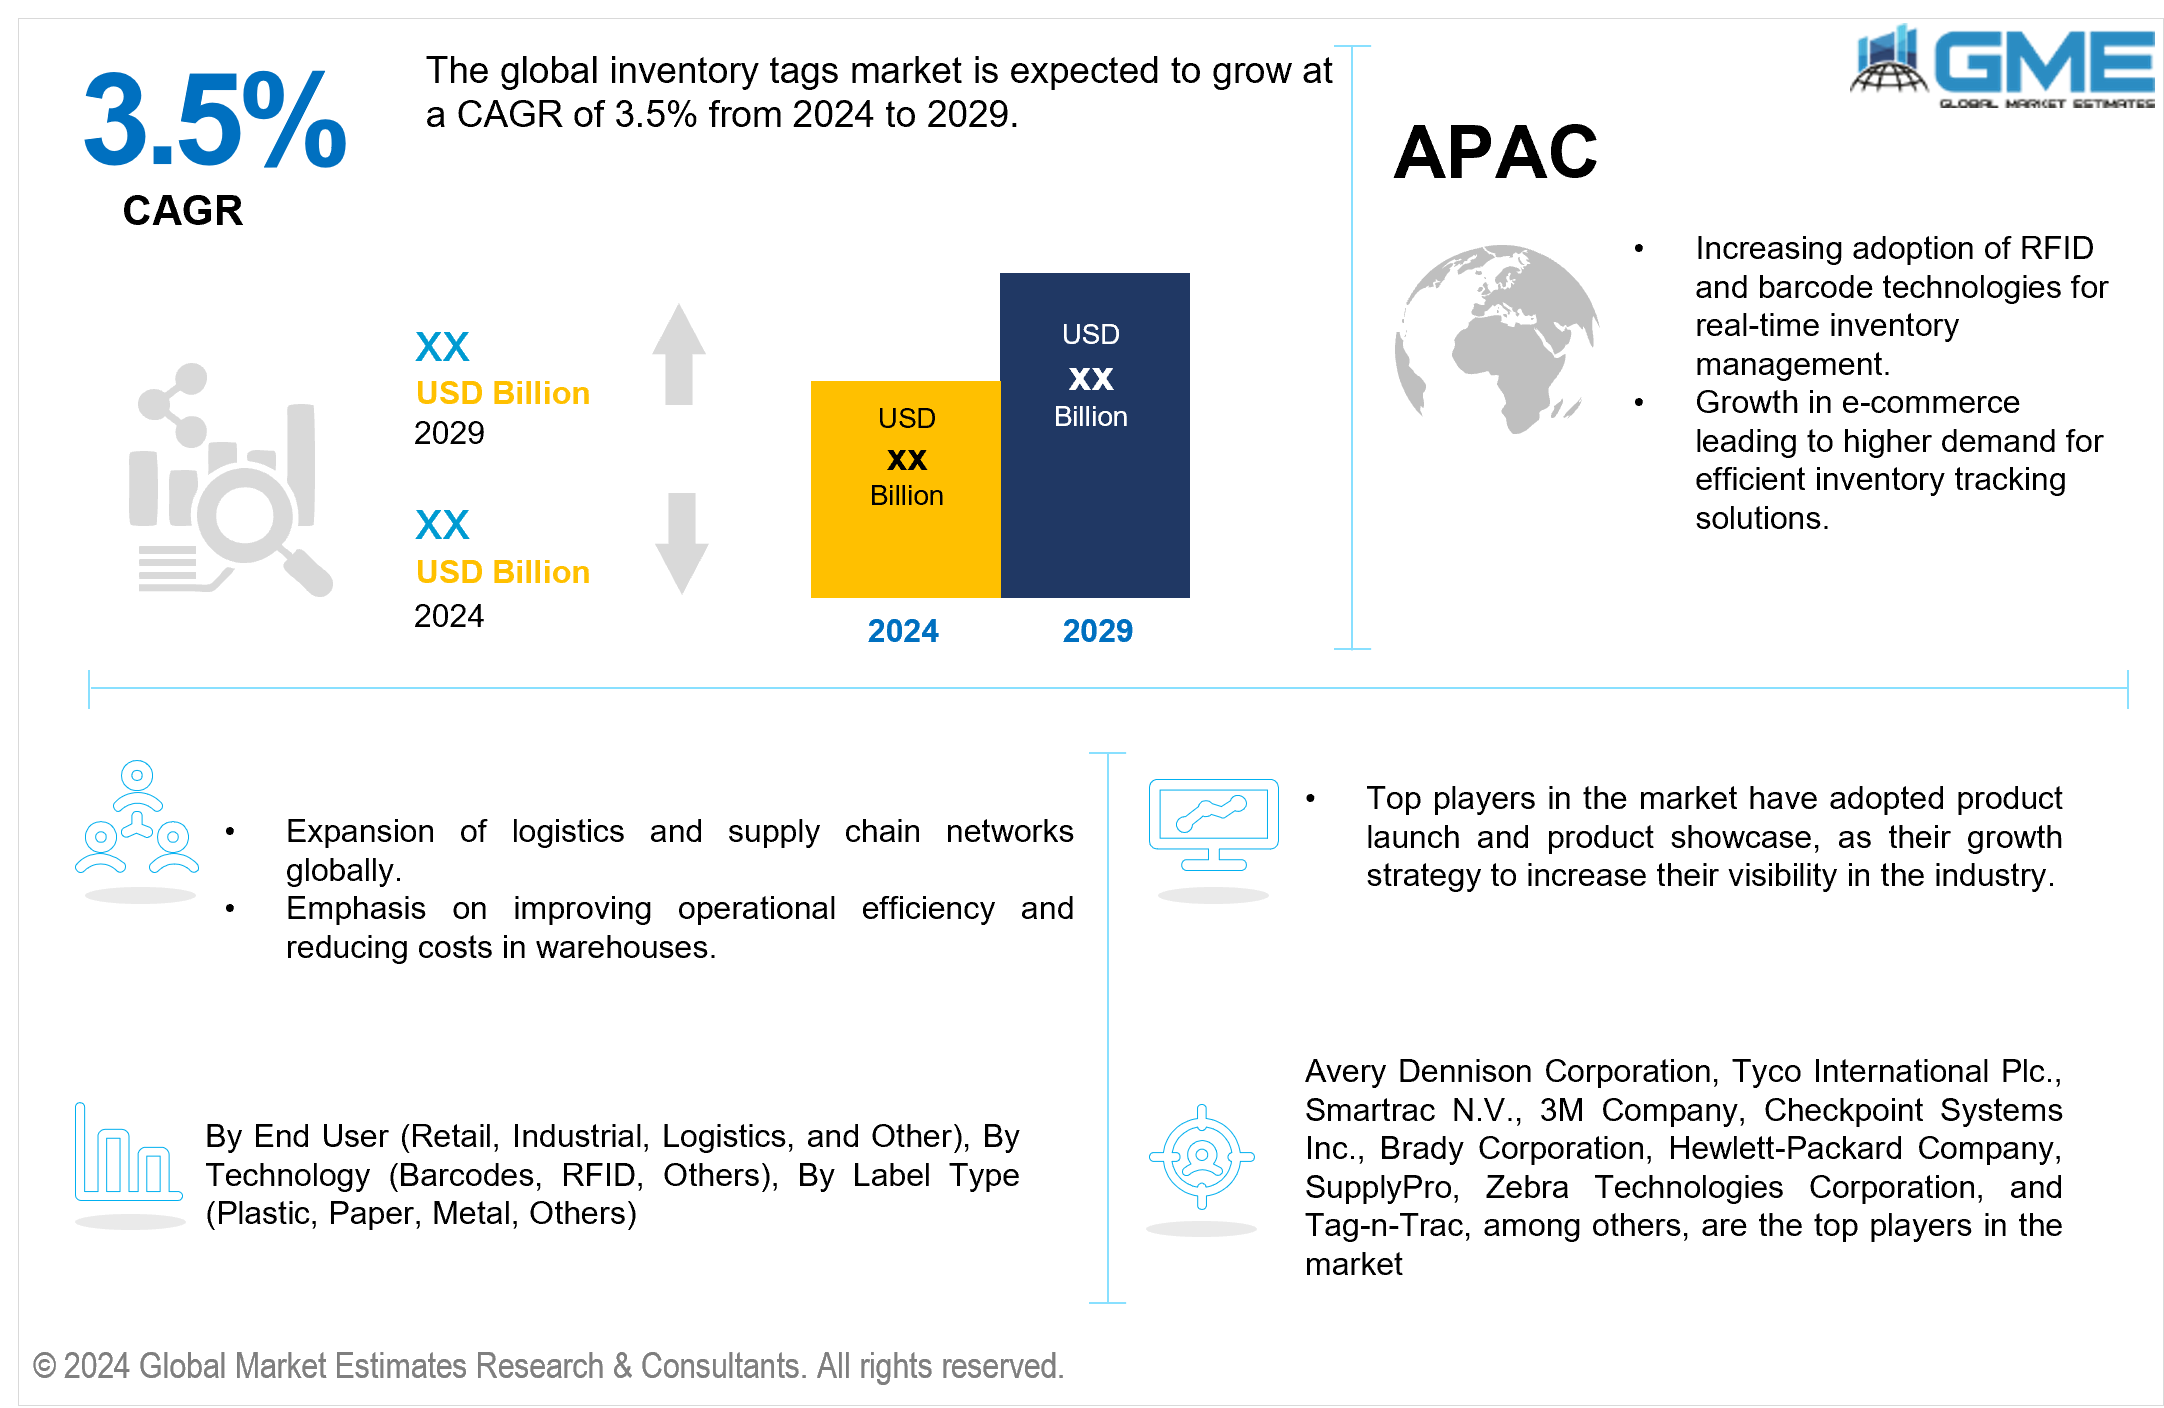
The global inventory tags market is expected to exhibit a CAGR of 3.5% from 2024 to 2029.
The inventory tags market is witnessing significant growth, driven by the adoption of advanced technologies such as barcode inventory labels, RFID tag printing, and asset tracking labels. These innovations have revolutionized inventory management tags, offering customizable label solutions for various industries. Warehouse labeling systems and label printing software enable efficient organization and tracking of assets. Industrial labeling solutions, including printable asset tags and inventory control tags, ensure accuracy and durability. The market also caters to specific needs with label printer supplies, RFID label printers, and printable barcode labels. Label design software and retail inventory tags further enhance the utility of these solutions, while logistics labeling solutions and tag printing services address the demands of the supply chain. Overall, the integration of labeling technology, labeling equipment, and inventory tagging solutions has streamlined operations across sectors.
Key drivers fueling the growth of the inventory tags market include the increasing adoption of automated inventory management systems across industries. These systems rely heavily on accurate and efficient tagging solutions to optimize supply chains and minimize operational costs. Moreover, the rising demand for RFID and barcode technologies, driven by their ability to provide real-time tracking and data analytics capabilities, is significantly boosting market growth. Additionally, stringent regulatory requirements in sectors such as healthcare and retail are driving the adoption of inventory tags for compliance and inventory control purposes. As businesses continue to prioritize efficiency and accuracy in inventory management, the demand for innovative and technologically advanced inventory tagging solutions is expected to grow steadily.
The retail segment is anticipated to emerge as the largest end-user in the global inventory tags market. Retailers rely heavily on efficient inventory management systems to streamline operations, reduce shrinkage, and enhance customer experience. The need for accurate stock tracking, quick replenishment processes, and the integration of advanced technologies like RFID and barcode systems has driven the adoption of printable inventory tags in the retail sector. These tags help retailers maintain real-time inventory visibility, which is crucial for managing large volumes of goods and ensuring timely availability of products on the shelves.
On the other hand, the logistics segment is analyzed to be the fastest-growing end-user in the inventory tags market. The logistics industry's rapid growth is fueled by the exponential rise of e-commerce, increasing global trade activities, and the demand for efficient supply chain management. Printable inventory tags in logistics help track shipments, reduce errors in order fulfillment, and improve overall operational efficiency. With the continuous expansion of global trade networks and the increasing need for robust logistics solutions, the demand for printable inventory tags in this segment is expected to witness significant growth in the coming years .
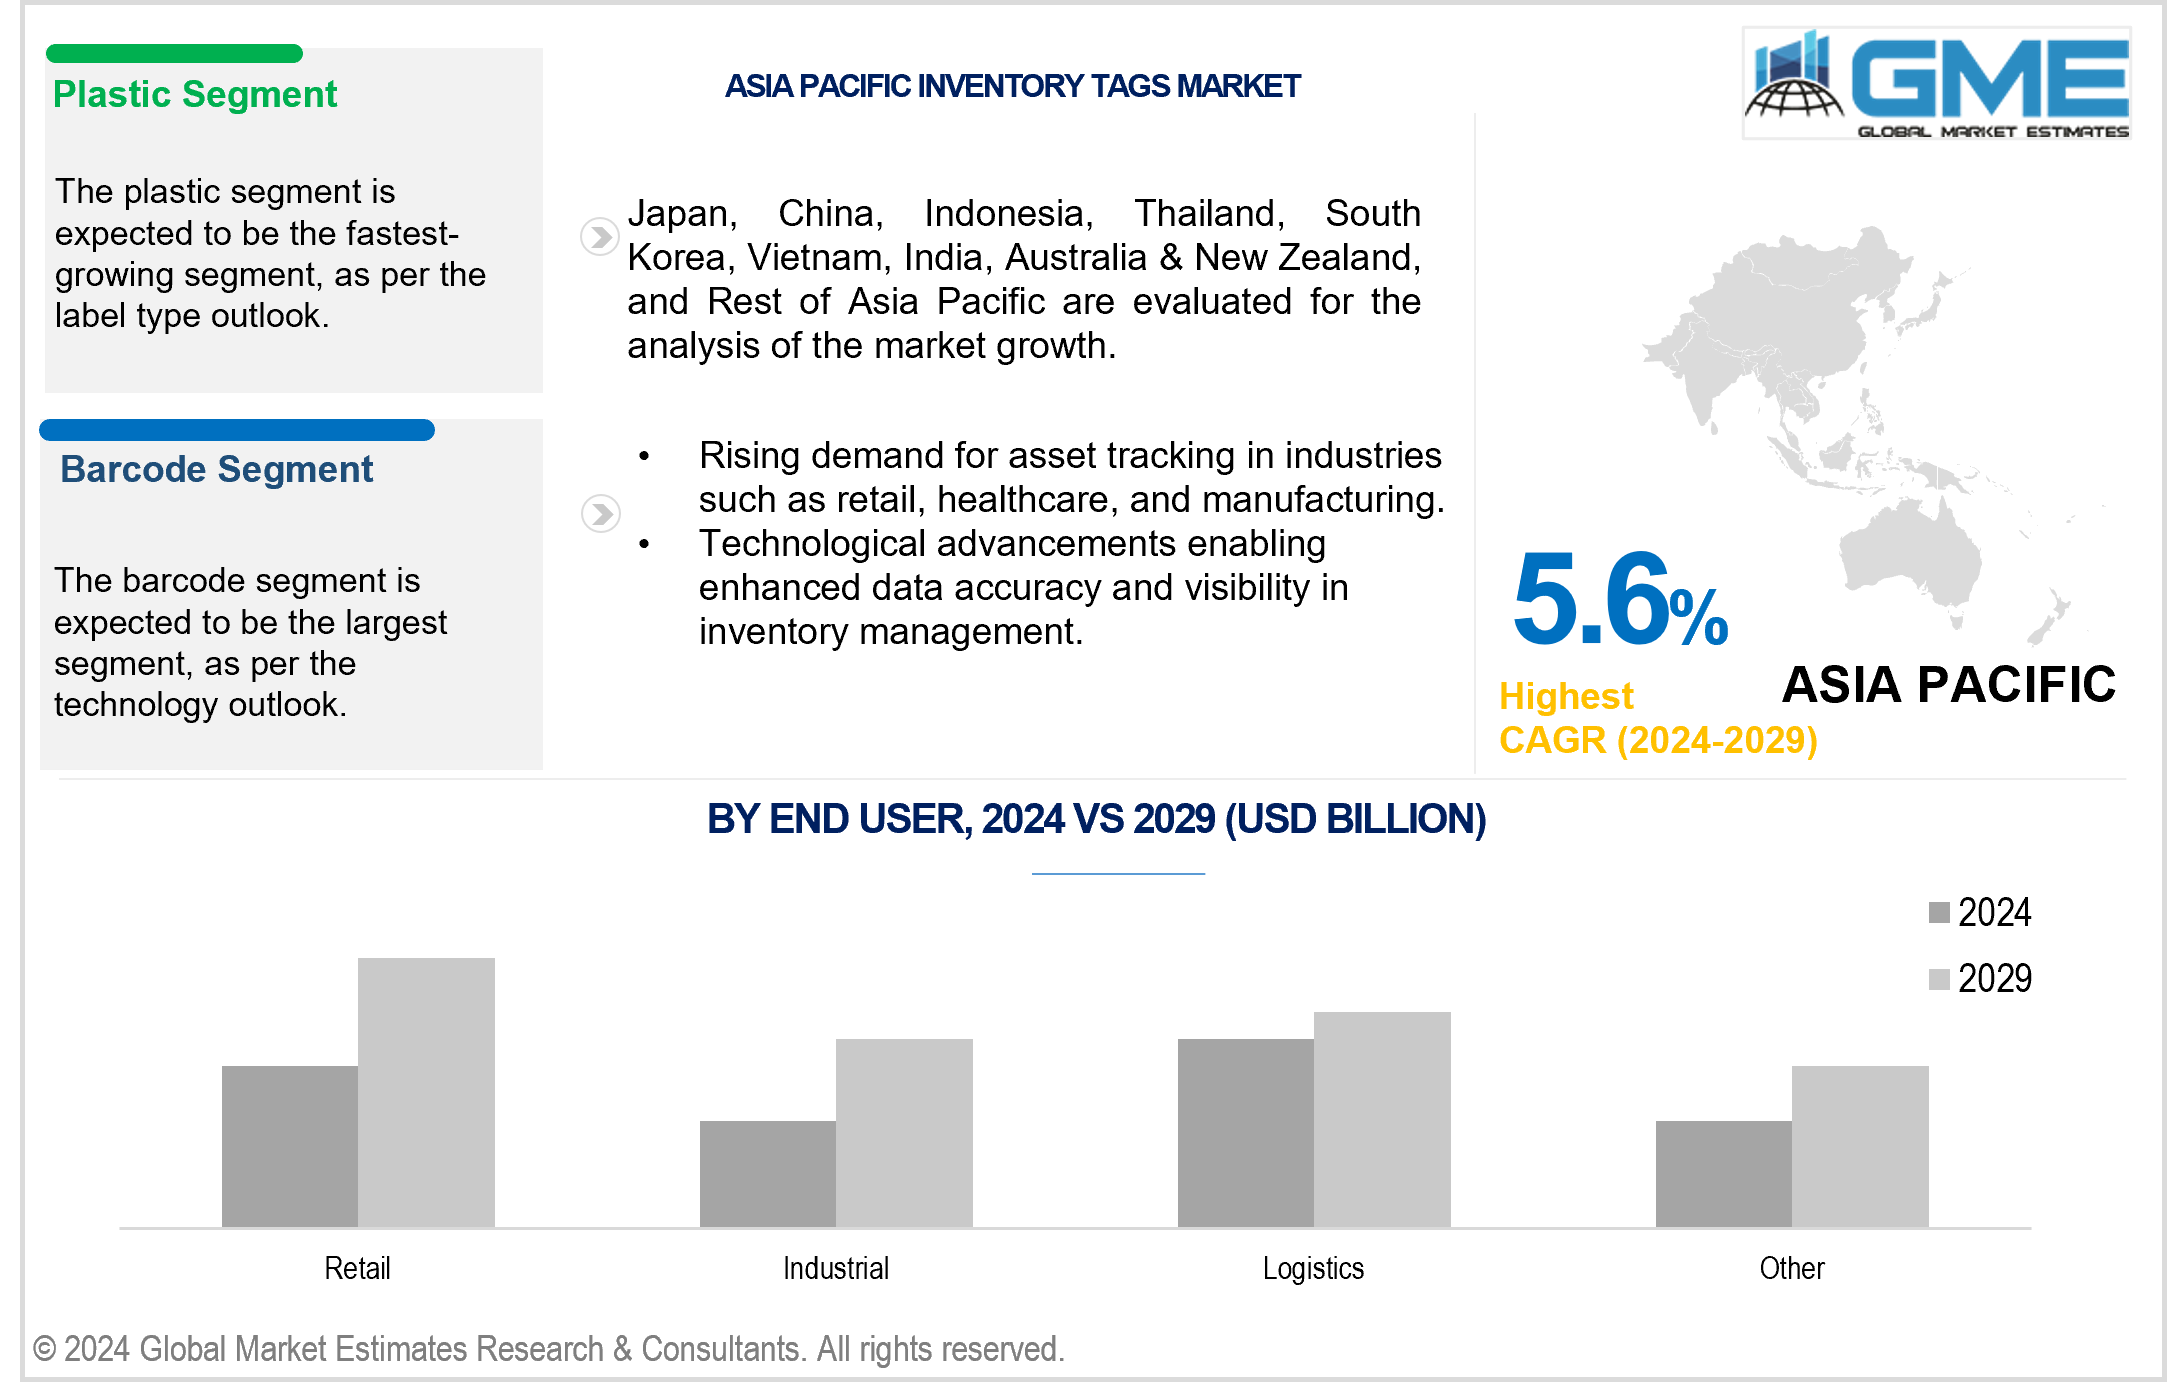
In the global inventory tags market, the barcode technology segment is expected to be the largest segment. Barcodes are widely adopted due to their simplicity, cost-effectiveness, and ease of integration into existing inventory management systems. They provide a reliable and efficient method for tracking and managing inventory across various industries. Retailers, manufacturers, and warehouses extensively use barcode tags for quick scanning and accurate data capture, facilitating seamless inventory control and reducing manual errors.
Conversely, the RFID technology segment is the fastest-growing inventory tag market. RFID tags offer significant advantages over traditional barcode systems, such as the ability to read multiple tags simultaneously and without line-of-sight requirements. This technology enhances inventory accuracy, improves asset tracking, and enables real-time inventory visibility. The growing adoption of RFID technology in industries such as logistics, healthcare, and manufacturing is driven by the need for more sophisticated and automated inventory management solutions, positioning RFID as the rapidly expanding segment in this market.
In the global inventory tags market, the paper segment is expected to emerge as the largest segment by label type. Paper labels are widely preferred due to their cost-effectiveness, versatility, and ease of printing. They are commonly used in various industries, including retail, logistics, and manufacturing, for labeling products, packages, and inventory items. The affordability and adaptability of paper labels make them a popular choice for businesses seeking efficient and economical inventory management solutions.
On the other hand, the plastic label type is anticipated to be the fastest-growing segment in the inventory tags market. Plastic labels offer durability, resistance to environmental factors, and longevity, making them ideal for harsh industrial environments and long-term usage. The increasing demand for robust and weather-resistant labeling solutions, particularly in industries such as logistics, automotive, and construction, is driving the rapid growth of plastic labels. Their ability to withstand wear and tear, exposure to chemicals, and extreme temperatures positions plastic labels as the rapidly expanding segment in this market.
North America is anticipated to be the largest region in the global inventory tags market over the forecast period. The region's dominance can be attributed to the well-established retail, logistics, and industrial sectors relying on efficient inventory management systems. The high adoption rate of advanced technologies, such as RFID and barcode systems, has significantly contributed to the growth of the printable inventory tags market in North America. Additionally, the presence of leading market players and the increasing demand for efficient supply chain solutions have further bolstered the region's market position.
Asia Pacific (APAC) is expected to be the fastest-growing region in the global inventory tags market. Rapid industrialization, the expanding e-commerce sector, and growing manufacturing activities in countries like China, India, and Japan have fueled the demand for effective inventory management solutions. The increasing focus on automation and technological advancements, coupled with the rising need for efficient logistics and supply chain management, are driving the growth of the printable inventory tags market in APAC. Furthermore, the region's burgeoning retail sector and the growing adoption of smart inventory management practices are expected to sustain its rapid market growth.
Avery Dennison Corporation, Tyco International Plc., Smartrac N.V., 3M Company, Checkpoint Systems Inc., Brady Corporation, Hewlett-Packard Company, SupplyPro, Zebra Technologies Corporation, and Tag-n-Trac, among others, are the top players in the market.
Please note: This is not an exhaustive list of companies profiled in the report.
In February 2024, Tag-n-Trac, a company that modernized global shipping and logistics for the Fortune 500, introduced several new capabilities to its RELATIVITY platform for tracking and tracing assets both in-warehouse and in-transit on a global scale. With a focus on automation and insights across in-warehouse and multi-modal in-transit shipping, RELATIVITY provided real-time asset tracking throughout the entire journey, from the factory warehouse through shipping to the moment of delivery, viewable from a single dashboard.
In August 2023, SupplyPro proudly announced the launch of its game-changing Inventory Shelf Tag, part of the UStockit platform. Building on the success of the beta testing phase, the UStockit Inventory Shelf Tag was made available for sale, meeting the overwhelming demand from distributors and customers seeking innovative and cost-effective inventory management solutions.
1 STRATEGIC INSIGHTS ON NEW REVENUE POCKETS
1.1 Strategic Opportunity & Attractiveness Analysis
1.1.1 Hot Revenue Pockets
1.1.2 Market Attractiveness Score
1.1.3 Revenue Impacting Opportunity
1.1.4 High Growing Region/Country
1.1.5 Competitor Analysis
1.1.6 Consumer Analysis
1.2 Global Market Estimates' View
1.3 Strategic Insights across Business Functions
1.3.1 For Chief Executive Officers
1.3.2 For Chief Marketing Officers
1.3.3 For Chief Strategy Officers
1.4 Evaluate the Potential of your Existing Business Lines vs. New Lines to Enter Into
2 TECHNOLOGICAL TRENDS
2.1 Technological Adoption Rate
2.2 Current Trend Impact Analysis
2.3 Future Trend Impact Analysis
3 GLOBAL INVENTORY TAGS MARKET OUTLOOK
3.1 Market Pyramid Analysis
3.1.1 Introduction
3.1.2 Adjacent Market Opportunities
3.1.3 Ancillary Market Opportunities
3.2 Demand Side Analysis
3.2.1 Market Drivers: Impact Analysis
3.2.2 Market Restraints: Impact Analysis
3.2.3 Market Opportunities: Impact Analysis
3.2.4 Market Challenges: Impact Analysis
3.3 Supply Side Analysis
3.3.1 Porter’s Five Forces Analysis
3.3.1.1 Threat of New Entrants
3.3.1.2 Threat of New Substitutes
3.3.1.3 Bargaining Power of Suppliers
3.3.1.4 Bargaining Power of Buyers
3.3.1.5 Intensity of Competitive Rivalry
3.3.2 SWOT Analysis; By Factor (Political & Legal, Economic, and Technological)
3.3.2.1 Political Landscape
3.3.2.2 Economic Landscape
3.3.2.3 Social Landscape
3.3.2.4 Technology Landscape
3.3.3 Value Chain Analysis
3.3.4 Trend Analysis
3.3.5 Gap Analysis
3.3.6 Cost Analysis
4 GLOBAL INVENTORY TAGS MARKET, BY END USER
4.1 Introduction
4.2 Inventory Tags Market: End User Scope Key Takeaways
4.3 Revenue Growth Analysis, 2023 & 2029
4.4 Retail
4.4.1 Retail Market Estimates and Forecast, 2021-2029 (USD Million)
4.5 Industrial
4.5.1 Industrial Market Estimates and Forecast, 2021-2029 (USD Million)
4.6 Logistics
4.6.1 Logistics Market Estimates and Forecast, 2021-2029 (USD Million)
4.7 Others
4.7.1 Others Market Estimates and Forecast, 2021-2029 (USD Million)
5 GLOBAL INVENTORY TAGS MARKET, BY TECHNOLOGY
5.1 Introduction
5.2 Inventory Tags Market: Technology Scope Key Takeaways
5.3 Revenue Growth Analysis, 2023 & 2029
5.4 Barcodes
5.4.1 Barcodes Market Estimates and Forecast, 2021-2029 (USD Million)
5.5 RFID
5.5.1 RFID Market Estimates and Forecast, 2021-2029 (USD Million)
5.6 Others
5.6.1 Others Market Estimates and Forecast, 2021-2029 (USD Million)
6 GLOBAL INVENTORY TAGS MARKET, BY LABEL TYPE
6.1 Introduction
6.2 Inventory Tags Market: Label Type Scope Key Takeaways
6.3 Revenue Growth Analysis, 2023 & 2029
6.4 Plastic
6.4.1 Plastic Market Estimates and Forecast, 2021-2029 (USD Million)
6.5 Paper
6.5.1 Paper Market Estimates and Forecast, 2021-2029 (USD Million)
6.6 Metal
6.6.1 Metal Market Estimates and Forecast, 2021-2029 (USD Million)
6.7 Others
6.7.1 Others Market Estimates and Forecast, 2021-2029 (USD Million)
7 GLOBAL INVENTORY TAGS MARKET, BY REGION
7.1 Introduction
7.2 North America Inventory Tags Market Estimates and Forecast, 2021-2029 (USD Million)
7.2.1 By End User
7.2.2 By Technology
7.2.3 By Label Type
7.2.4 By Country
7.2.4.1 U.S. Inventory Tags Market Estimates and Forecast, 2021-2029 (USD Million)
7.2.4.1.1 By End User
7.2.4.1.2 By Technology
7.2.4.1.3 By Label Type
7.2.4.2 Canada Inventory Tags Market Estimates and Forecast, 2021-2029 (USD Million)
7.2.4.2.1 By End User
7.2.4.2.2 By Technology
7.2.4.2.3 By Label Type
7.2.4.3 Mexico Inventory Tags Market Estimates and Forecast, 2021-2029 (USD Million)
7.2.4.3.1 By End User
7.2.4.3.2 By Technology
7.2.4.3.3 By Label Type
7.3 Europe Inventory Tags Market Estimates and Forecast, 2021-2029 (USD Million)
7.3.1 By End User
7.3.2 By Technology
7.3.3 By Label Type
7.3.4 By Country
7.3.4.1 Germany Inventory Tags Market Estimates and Forecast, 2021-2029 (USD Million)
7.3.4.1.1 By End User
7.3.4.1.2 By Technology
7.3.4.1.3 By Label Type
7.3.4.2 U.K. Inventory Tags Market Estimates and Forecast, 2021-2029 (USD Million)
7.3.4.2.1 By End User
7.3.4.2.2 By Technology
7.3.4.2.3 By Label Type
7.3.4.3 France Inventory Tags Market Estimates and Forecast, 2021-2029 (USD Million)
7.3.4.3.1 By End User
7.3.4.3.2 By Technology
7.3.4.3.3 By Label Type
7.3.4.4 Italy Inventory Tags Market Estimates and Forecast, 2021-2029 (USD Million)
7.3.4.4.1 By End User
7.3.4.4.2 By Technology
7.2.4.4.3 By Label Type
7.3.4.5 Spain Inventory Tags Market Estimates and Forecast, 2021-2029 (USD Million)
7.3.4.5.1 By End User
7.3.4.5.2 By Technology
7.2.4.5.3 By Label Type
7.3.4.6 Netherlands Inventory Tags Market Estimates and Forecast, 2021-2029 (USD Million)
7.3.4.6.1 By End User
7.3.4.6.2 By Technology
7.2.4.6.3 By Label Type
7.3.4.7 Rest of Europe Inventory Tags Market Estimates and Forecast, 2021-2029 (USD Million)
7.3.4.7.1 By End User
7.3.4.7.2 By Technology
7.2.4.7.3 By Label Type
7.4 Asia Pacific Inventory Tags Market Estimates and Forecast, 2021-2029 (USD Million)
7.4.1 By End User
7.4.2 By Technology
7.4.3 By Label Type
7.4.4 By Country
7.4.4.1 China Inventory Tags Market Estimates and Forecast, 2021-2029 (USD Million)
7.4.4.1.1 By End User
7.4.4.1.2 By Technology
7.4.4.1.3 By Label Type
7.4.4.2 Japan Inventory Tags Market Estimates and Forecast, 2021-2029 (USD Million)
7.4.4.2.1 By End User
7.4.4.2.2 By Technology
7.4.4.2.3 By Label Type
7.4.4.3 India Inventory Tags Market Estimates and Forecast, 2021-2029 (USD Million)
7.4.4.3.1 By End User
7.4.4.3.2 By Technology
7.4.4.3.3 By Label Type
7.4.4.4 South Korea Inventory Tags Market Estimates and Forecast, 2021-2029 (USD Million)
7.4.4.4.1 By End User
7.4.4.4.2 By Technology
7.4.4.4.3 By Label Type
7.4.4.5 Singapore Inventory Tags Market Estimates and Forecast, 2021-2029 (USD Million)
7.4.4.5.1 By End User
7.4.4.5.2 By Technology
7.4.4.5.3 By Label Type
7.4.4.6 Malaysia Inventory Tags Market Estimates and Forecast, 2021-2029 (USD Million)
7.4.4.6.1 By End User
7.4.4.6.2 By Technology
7.4.4.6.3 By Label Type
7.4.4.7 Thailand Inventory Tags Market Estimates and Forecast, 2021-2029 (USD Million)
7.4.4.7.1 By End User
7.4.4.7.2 By Technology
7.4.4.7.3 By Label Type
7.4.4.8 Indonesia Inventory Tags Market Estimates and Forecast, 2021-2029 (USD Million)
7.4.4.8.1 By End User
7.4.4.8.2 By Technology
7.4.4.8.3 By Label Type
7.4.4.9 Vietnam Inventory Tags Market Estimates and Forecast, 2021-2029 (USD Million)
7.4.4.9.1 By End User
7.4.4.9.2 By Technology
7.4.4.9.3 By Label Type
7.4.4.10 Taiwan Inventory Tags Market Estimates and Forecast, 2021-2029 (USD Million)
7.4.4.10.1 By End User
7.4.4.10.2 By Technology
7.4.4.10.3 By Label Type
7.4.4.11 Rest of Asia Pacific Inventory Tags Market Estimates and Forecast, 2021-2029 (USD Million)
7.4.4.11.1 By End User
7.4.4.11.2 By Technology
7.4.4.11.3 By Label Type
7.5 Middle East and Africa Inventory Tags Market Estimates and Forecast, 2021-2029 (USD Million)
7.5.1 By End User
7.5.2 By Technology
7.5.3 By Label Type
7.5.4 By Country
7.5.4.1 Saudi Arabia Inventory Tags Market Estimates and Forecast, 2021-2029 (USD Million)
7.5.4.1.1 By End User
7.5.4.1.2 By Technology
7.5.4.1.3 By Label Type
7.5.4.2 U.A.E. Inventory Tags Market Estimates and Forecast, 2021-2029 (USD Million)
7.5.4.2.1 By End User
7.5.4.2.2 By Technology
7.5.4.2.3 By Label Type
7.5.4.3 Israel Inventory Tags Market Estimates and Forecast, 2021-2029 (USD Million)
7.5.4.3.1 By End User
7.5.4.3.2 By Technology
7.5.4.3.3 By Label Type
7.5.4.4 South Africa Inventory Tags Market Estimates and Forecast, 2021-2029 (USD Million)
7.5.4.4.1 By End User
7.5.4.4.2 By Technology
7.5.4.4.3 By Label Type
7.5.4.5 Rest of Middle East and Africa Inventory Tags Market Estimates and Forecast, 2021-2029 (USD Million)
7.5.4.5.1 By End User
7.5.4.5.2 By Technology
7.5.4.5.2 By Label Type
7.6 Central and South America Inventory Tags Market Estimates and Forecast, 2021-2029 (USD Million)
7.6.1 By End User
7.6.2 By Technology
7.6.3 By Label Type
7.6.4 By Country
7.6.4.1 Brazil Inventory Tags Market Estimates and Forecast, 2021-2029 (USD Million)
7.6.4.1.1 By End User
7.6.4.1.2 By Technology
7.6.4.1.3 By Label Type
7.6.4.2 Argentina Inventory Tags Market Estimates and Forecast, 2021-2029 (USD Million)
7.6.4.2.1 By End User
7.6.4.2.2 By Technology
7.6.4.2.3 By Label Type
7.6.4.3 Chile Inventory Tags Market Estimates and Forecast, 2021-2029 (USD Million)
7.6.4.3.1 By End User
7.6.4.3.2 By Technology
7.6.4.3.3 By Label Type
7.6.4.4 Rest of Central and South America Inventory Tags Market Estimates and Forecast, 2021-2029 (USD Million)
7.6.4.4.1 By End User
7.6.4.4.2 By Technology
7.6.4.4.3 By Label Type
8 COMPETITIVE LANDCAPE
8.1 Company Market Share Analysis
8.2 Four Quadrant Positioning Matrix
8.2.1 Market Leaders
8.2.2 Market Visionaries
8.2.3 Market Challengers
8.2.4 Niche Market Players
8.3 Vendor Landscape
8.3.1 North America
8.3.2 Europe
8.3.3 Asia Pacific
8.3.4 Rest of the World
8.4 Company Profiles
8.4.1 Avery Dennison Corporation
8.4.1.1 Business Description & Financial Analysis
8.4.1.2 SWOT Analysis
8.4.1.3 Products & Services Offered
8.4.1.4 Strategic Alliances between Business Partners
8.4.2 Tyco International Plc.
8.4.2.1 Business Description & Financial Analysis
8.4.2.2 SWOT Analysis
8.4.2.3 Products & Services Offered
8.4.2.4 Strategic Alliances between Business Partners
8.4.3 Smartrac N.V.
8.4.3.1 Business Description & Financial Analysis
8.4.3.2 SWOT Analysis
8.4.3.3 Products & Services Offered
8.4.3.4 Strategic Alliances between Business Partners
8.4.4 3M Company
8.4.4.1 Business Description & Financial Analysis
8.4.4.2 SWOT Analysis
8.4.4.3 Products & Services Offered
8.4.4.4 Strategic Alliances between Business Partners
8.4.5 Checkpoint Systems Inc.
8.4.5.1 Business Description & Financial Analysis
8.4.5.2 SWOT Analysis
8.4.5.3 Products & Services Offered
8.4.5.4 Strategic Alliances between Business Partners
8.4.6 Brady Corporation
8.4.6.1 Business Description & Financial Analysis
8.4.6.2 SWOT Analysis
8.4.6.3 Products & Services Offered
8.4.6.4 Strategic Alliances between Business Partners
8.4.7 Hewlett-Packard Company
8.4.7.1 Business Description & Financial Analysis
8.4.7.2 SWOT Analysis
8.4.7.3 Products & Services Offered
8.4.8.4 Strategic Alliances between Business Partners
8.4.8 SupplyPro
8.4.8.1 Business Description & Financial Analysis
8.4.8.2 SWOT Analysis
8.4.8.3 Products & Services Offered
8.4.8.4 Strategic Alliances between Business Partners
8.4.9 Tag-n-Trac
8.4.9.1 Business Description & Financial Analysis
8.4.9.2 SWOT Analysis
8.4.9.3 Products & Services Offered
8.4.9.4 Strategic Alliances between Business Partners
8.4.10 Zebra Technologies Corporation
8.4.10.1 Business Description & Financial Analysis
8.4.10.2 SWOT Analysis
8.4.10.3 Products & Services Offered
8.4.10.4 Strategic Alliances between Business Partners
8.4.11 Other Companies
8.4.11.1 Business Description & Financial Analysis
8.4.11.2 SWOT Analysis
8.4.11.3 Products & Services Offered
8.4.11.4 Strategic Alliances between Business Partners
9 RESEARCH METHODOLOGY
9.1 Market Introduction
9.1.1 Market Definition
9.1.2 Market Scope & Segmentation
9.2 Information Procurement
9.2.1 Secondary Research
9.2.1.1 Purchased Databases
9.2.1.2 GMEs Internal Data Repository
9.2.1.3 Secondary Resources & Third Party Perspectives
9.2.1.4 Company Information Sources
9.2.2 Primary Research
9.2.2.1 Various Types of Respondents for Primary Interviews
9.2.2.2 Number of Interviews Conducted throughout the Research Process
9.2.2.3 Primary Stakeholders
9.2.2.4 Discussion Guide for Primary Participants
9.2.3 Expert Panels
9.2.3.1 Expert Panels Across 30+ Industry
9.2.4 Paid Local Experts
9.2.4.1 Paid Local Experts Across 30+ Industry Across each Region
9.3 Market Estimation
9.3.1 Top-Down Approach
9.3.1.1 Macro-Economic Indicators Considered
9.3.1.2 Micro-Economic Indicators Considered
9.3.2 Bottom Up Approach
9.3.2.1 Company Share Analysis Approach
9.3.2.2 Estimation of Potential End UserSales
9.4 Data Triangulation
9.4.1 Data Collection
9.4.2 Time Series, Cross Sectional & Panel Data Analysis
9.4.3 Cluster Analysis
9.5 Analysis and Output
9.5.1 Inhouse AI Based Real Time Analytics Tool
9.5.2 Output From Desk & Primary Research
9.6 Research Assumptions & Limitations
9.7.1 Research Assumptions
9.7.2 Research Limitations
LIST OF TABLES
1 Global Inventory Tags Market, By End User, 2021-2029 (USD Mllion)
2 Retail Market, By Region, 2021-2029 (USD Mllion)
3 Industrial Market, By Region, 2021-2029 (USD Mllion)
4 Logistics Market, By Region, 2021-2029 (USD Mllion)
5 Others Market, By Region, 2021-2029 (USD Mllion)
6 Global Inventory Tags Market, By Technology, 2021-2029 (USD Mllion)
7 Barcodes Market, By Region, 2021-2029 (USD Mllion)
8 RFID Market, By Region, 2021-2029 (USD Mllion)
9 Others Market, By Region, 2021-2029 (USD Mllion)
10 Global Inventory Tags Market, By Label Type, 2021-2029 (USD Mllion)
11 Plastic Market, By Region, 2021-2029 (USD Mllion)
12 Paper Market, By Region, 2021-2029 (USD Mllion)
13 Metal Market, By Region, 2021-2029 (USD Mllion)
14 Others Market, By Region, 2021-2029 (USD Mllion)
15 Regional Analysis, 2021-2029 (USD Mllion)
16 North America Inventory Tags Market, By End User, 2021-2029 (USD Million)
17 North America Inventory Tags Market, By Technology, 2021-2029 (USD Million)
18 North America Inventory Tags Market, By Label Type, 2021-2029 (USD Million)
19 North America Inventory Tags Market, By Country, 2021-2029 (USD Million)
20 U.S Inventory Tags Market, By End User, 2021-2029 (USD Million)
21 U.S Inventory Tags Market, By Technology, 2021-2029 (USD Million)
22 U.S Inventory Tags Market, By Label Type, 2021-2029 (USD Million)
23 Canada Inventory Tags Market, By End User, 2021-2029 (USD Million)
24 Canada Inventory Tags Market, By Technology, 2021-2029 (USD Million)
25 Canada Inventory Tags Market, By Label Type, 2021-2029 (USD Million)
26 Mexico Inventory Tags Market, By End User, 2021-2029 (USD Million)
27 Mexico Inventory Tags Market, By Technology, 2021-2029 (USD Million)
28 Mexico Inventory Tags Market, By Label Type, 2021-2029 (USD Million)
29 Europe Inventory Tags Market, By End User, 2021-2029 (USD Million)
30 Europe Inventory Tags Market, By Technology, 2021-2029 (USD Million)
31 Europe Inventory Tags Market, By Label Type, 2021-2029 (USD Million)
32 Europe Inventory Tags Market, By Country 2021-2029 (USD Million)
33 Germany Inventory Tags Market, By End User, 2021-2029 (USD Million)
34 Germany Inventory Tags Market, By Technology, 2021-2029 (USD Million)
35 Germany Inventory Tags Market, By Label Type, 2021-2029 (USD Million)
36 U.K Inventory Tags Market, By End User, 2021-2029 (USD Million)
37 U.K Inventory Tags Market, By Technology, 2021-2029 (USD Million)
38 U.K Inventory Tags Market, By Label Type, 2021-2029 (USD Million)
39 France Inventory Tags Market, By End User, 2021-2029 (USD Million)
40 France Inventory Tags Market, By Technology, 2021-2029 (USD Million)
41 France Inventory Tags Market, By Label Type, 2021-2029 (USD Million)
42 Italy Inventory Tags Market, By End User, 2021-2029 (USD Million)
43 Italy Inventory Tags Market, By Technology, 2021-2029 (USD Million)
44 Italy Inventory Tags Market, By Label Type, 2021-2029 (USD Million)
45 Spain Inventory Tags Market, By End User, 2021-2029 (USD Million)
46 Spain Inventory Tags Market, By Technology, 2021-2029 (USD Million)
47 Spain Inventory Tags Market, By Label Type, 2021-2029 (USD Million)
48 Netherlands Inventory Tags Market, By End User, 2021-2029 (USD Million)
49 Netherlands Inventory Tags Market, By Technology, 2021-2029 (USD Million)
50 Netherlands Inventory Tags Market, By Label Type, 2021-2029 (USD Million)
51 Rest Of Europe Inventory Tags Market, By End User, 2021-2029 (USD Million)
52 Rest Of Europe Inventory Tags Market, By Technology, 2021-2029 (USD Million)
53 Rest of Europe Inventory Tags Market, By Label Type, 2021-2029 (USD Million)
54 Asia Pacific Inventory Tags Market, By End User, 2021-2029 (USD Million)
55 Asia Pacific Inventory Tags Market, By Technology, 2021-2029 (USD Million)
56 Asia Pacific Inventory Tags Market, By Label Type, 2021-2029 (USD Million)
57 Asia Pacific Inventory Tags Market, By Country, 2021-2029 (USD Million)
58 China Inventory Tags Market, By End User, 2021-2029 (USD Million)
59 China Inventory Tags Market, By Technology, 2021-2029 (USD Million)
60 China Inventory Tags Market, By Label Type, 2021-2029 (USD Million)
61 India Inventory Tags Market, By End User, 2021-2029 (USD Million)
62 India Inventory Tags Market, By Technology, 2021-2029 (USD Million)
63 India Inventory Tags Market, By Label Type, 2021-2029 (USD Million)
64 Japan Inventory Tags Market, By End User, 2021-2029 (USD Million)
65 Japan Inventory Tags Market, By Technology, 2021-2029 (USD Million)
66 Japan Inventory Tags Market, By Label Type, 2021-2029 (USD Million)
67 South Korea Inventory Tags Market, By End User, 2021-2029 (USD Million)
68 South Korea Inventory Tags Market, By Technology, 2021-2029 (USD Million)
69 South Korea Inventory Tags Market, By Label Type, 2021-2029 (USD Million)
70 malaysia Inventory Tags Market, By End User, 2021-2029 (USD Million)
71 malaysia Inventory Tags Market, By Technology, 2021-2029 (USD Million)
72 malaysia Inventory Tags Market, By Label Type, 2021-2029 (USD Million)
73 Thailand Inventory Tags Market, By End User, 2021-2029 (USD Million)
74 Thailand Inventory Tags Market, By Technology, 2021-2029 (USD Million)
75 Thailand Inventory Tags Market, By Label Type, 2021-2029 (USD Million)
76 Indonesia Inventory Tags Market, By End User, 2021-2029 (USD Million)
77 Indonesia Inventory Tags Market, By Technology, 2021-2029 (USD Million)
78 Indonesia Inventory Tags Market, By Label Type, 2021-2029 (USD Million)
79 Vietnam Inventory Tags Market, By End User, 2021-2029 (USD Million)
80 Vietnam Inventory Tags Market, By Technology, 2021-2029 (USD Million)
81 Vietnam Inventory Tags Market, By Label Type, 2021-2029 (USD Million)
82 Taiwan Inventory Tags Market, By End User, 2021-2029 (USD Million)
83 Taiwan Inventory Tags Market, By Technology, 2021-2029 (USD Million)
84 Taiwan Inventory Tags Market, By Label Type, 2021-2029 (USD Million)
85 Rest of Asia Pacific Inventory Tags Market, By End User, 2021-2029 (USD Million)
86 Rest of Asia Pacific Inventory Tags Market, By Technology, 2021-2029 (USD Million)
87 Rest of Asia Pacific Inventory Tags Market, By Label Type, 2021-2029 (USD Million)
88 Middle East and Africa Inventory Tags Market, By End User, 2021-2029 (USD Million)
89 Middle East and Africa Inventory Tags Market, By Technology, 2021-2029 (USD Million)
90 Middle East and Africa Inventory Tags Market, By Label Type, 2021-2029 (USD Million)
91 Middle East and Africa Inventory Tags Market, By Country, 2021-2029 (USD Million)
92 Saudi Arabia Inventory Tags Market, By End User, 2021-2029 (USD Million)
93 Saudi Arabia Inventory Tags Market, By Technology, 2021-2029 (USD Million)
94 Saudi Arabia Inventory Tags Market, By Label Type, 2021-2029 (USD Million)
95 UAE Inventory Tags Market, By End User, 2021-2029 (USD Million)
96 UAE Inventory Tags Market, By Technology, 2021-2029 (USD Million)
97 UAE Inventory Tags Market, By Label Type, 2021-2029 (USD Million)
98 Israel Inventory Tags Market, By End User, 2021-2029 (USD Million)
99 Israel Inventory Tags Market, By Technology, 2021-2029 (USD Million)
100 Israel Inventory Tags Market, By Label Type, 2021-2029 (USD Million)
101 South Africa Inventory Tags Market, By End User, 2021-2029 (USD Million)
102 South Africa Inventory Tags Market, By Technology, 2021-2029 (USD Million)
103 South Africa Inventory Tags Market, By Label Type, 2021-2029 (USD Million)
104 Rest of Middle East and Africa Inventory Tags Market, By End User, 2021-2029 (USD Million)
105 Rest of Middle East and Africa Inventory Tags Market, By Technology, 2021-2029 (USD Million)
106 Rest of Middle East and Africa Inventory Tags Market, By Label Type, 2021-2029 (USD Million)
107 Central and South America Inventory Tags Market, By End User, 2021-2029 (USD Million)
108 Central and South America Inventory Tags Market, By Technology, 2021-2029 (USD Million)
109 Central and South America Inventory Tags Market, By Label Type, 2021-2029 (USD Million)
110 Central and South America Inventory Tags Market, By Country, 2021-2029 (USD Million)
111 Brazil Inventory Tags Market, By End User, 2021-2029 (USD Million)
112 Brazil Inventory Tags Market, By Technology, 2021-2029 (USD Million)
113 Brazil Inventory Tags Market, By Label Type, 2021-2029 (USD Million)
114 Argentina Inventory Tags Market, By End User, 2021-2029 (USD Million)
115 Argentina Inventory Tags Market, By Technology, 2021-2029 (USD Million)
116 Argentina Inventory Tags Market, By Label Type, 2021-2029 (USD Million)
117 Chile Inventory Tags Market, By End User, 2021-2029 (USD Million)
118 Chile Inventory Tags Market, By Technology, 2021-2029 (USD Million)
119 Chile Inventory Tags Market, By Label Type, 2021-2029 (USD Million)
120 Rest of Central and South America Inventory Tags Market, By End User, 2021-2029 (USD Million)
121 Rest of Central and South America Inventory Tags Market, By Technology, 2021-2029 (USD Million)
122 Rest of Central and South America Inventory Tags Market, By Label Type, 2021-2029 (USD Million)
123 Avery Dennison Corporation: Products & Services Offering
124 Tyco International Plc.: Products & Services Offering
125 Smartrac N.V.: Products & Services Offering
126 3M Company: Products & Services Offering
127 Checkpoint Systems Inc.: Products & Services Offering
128 Brady Corporation: Products & Services Offering
129 Hewlett-Packard Company: Products & Services Offering
130 SupplyPro: Products & Services Offering
131 Tag-n-Trac, Inc: Products & Services Offering
132 Zebra Technologies Corporation: Products & Services Offering
133 Other Companies: Products & Services Offering
LIST OF FIGURES
1 Global Inventory Tags Market Overview
2 Global Inventory Tags Market Value From 2021-2029 (USD Mllion)
3 Global Inventory Tags Market Share, By End User (2023)
4 Global Inventory Tags Market Share, By Technology (2023)
5 Global Inventory Tags Market Share, By Label Type (2023)
6 Global Inventory Tags Market, By Region (Asia Pacific Market)
7 Technological Trends In Global Inventory Tags Market
8 Four Quadrant Competitor Positioning Matrix
9 Impact Of Macro & Micro Indicators On The Market
10 Impact Of Key Drivers On The Global Inventory Tags Market
11 Impact Of Challenges On The Global Inventory Tags Market
12 Porter’s Five Forces Analysis
13 Global Inventory Tags Market: By End UserScope Key Takeaways
14 Global Inventory Tags Market, By End UserSegment: Revenue Growth Analysis
15 Retail Market, By Region, 2021-2029 (USD Mllion)
16 Industrial Market, By Region, 2021-2029 (USD Mllion)
17 Logistics Market, By Region, 2021-2029 (USD Mllion)
18 Others Market, By Region, 2021-2029 (USD Mllion)
19 Global Inventory Tags Market: By Technology Scope Key Takeaways
20 Global Inventory Tags Market, By Technology Segment: Revenue Growth Analysis
21 Barcodes Market, By Region, 2021-2029 (USD Mllion)
22 RFID Market, By Region, 2021-2029 (USD Mllion)
23 Others Market, By Region, 2021-2029 (USD Mllion)
24 Global Inventory Tags Market: By Label Type Scope Key Takeaways
25 Global Inventory Tags Market, By Label Type Segment: Revenue Growth Analysis
26 Plastic Market, By Region, 2021-2029 (USD Mllion)
27 Paper Market, By Region, 2021-2029 (USD Mllion)
28 Metal Market, By Region, 2021-2029 (USD Mllion)
29 Others Market, By Region, 2021-2029 (USD Mllion)
30 Regional Segment: Revenue Growth Analysis
31 Global Inventory Tags Market: Regional Analysis
32 North America Inventory Tags Market Overview
33 North America Inventory Tags Market, By End User
34 North America Inventory Tags Market, By Technology
35 North America Inventory Tags Market, By Label Type
36 North America Inventory Tags Market, By Country
37 U.S. Inventory Tags Market, By End User
38 U.S. Inventory Tags Market, By Technology
39 U.S. Inventory Tags Market, By Label Type
40 Canada Inventory Tags Market, By End User
41 Canada Inventory Tags Market, By Technology
42 Canada Inventory Tags Market, By Label Type
43 Mexico Inventory Tags Market, By End User
44 Mexico Inventory Tags Market, By Technology
45 Mexico Inventory Tags Market, By Label Type
46 Four Quadrant Positioning Matrix
47 Company Market Share Analysis
48 Avery Dennison Corporation: Company Snapshot
49 Avery Dennison Corporation: SWOT Analysis
50 Avery Dennison Corporation: Geographic Presence
51 Tyco International Plc.: Company Snapshot
52 Tyco International Plc.: SWOT Analysis
53 Tyco International Plc.: Geographic Presence
54 Smartrac N.V.: Company Snapshot
55 Smartrac N.V.: SWOT Analysis
56 Smartrac N.V.: Geographic Presence
57 3M Company: Company Snapshot
58 3M Company: Swot Analysis
59 3M Company: Geographic Presence
60 Checkpoint Systems Inc.: Company Snapshot
61 Checkpoint Systems Inc.: SWOT Analysis
62 Checkpoint Systems Inc.: Geographic Presence
63 Brady Corporation: Company Snapshot
64 Brady Corporation: SWOT Analysis
65 Brady Corporation: Geographic Presence
66 Hewlett-Packard Company : Company Snapshot
67 Hewlett-Packard Company : SWOT Analysis
68 Hewlett-Packard Company : Geographic Presence
69 SupplyPro: Company Snapshot
70 SupplyPro: SWOT Analysis
71 SupplyPro: Geographic Presence
72 Tag-n-Trac, Inc.: Company Snapshot
73 Tag-n-Trac, Inc.: SWOT Analysis
74 Tag-n-Trac, Inc.: Geographic Presence
75 Zebra Technologies Corporation: Company Snapshot
76 Zebra Technologies Corporation: SWOT Analysis
77 Zebra Technologies Corporation: Geographic Presence
78 Other Companies: Company Snapshot
79 Other Companies: SWOT Analysis
80 Other Companies: Geographic Presence
The Global Inventory Tags Market has been studied from the year 2019 till 2029. However, the CAGR provided in the report is from the year 2024 to 2029. The research methodology involved three stages: Desk research, Primary research, and Analysis & Output from the entire research process.

The desk research involved a robust background study which meant referring to paid and unpaid databases to understand the market dynamics; mapping contracts from press releases; identifying the key players in the market, studying their product portfolio, competition level, annual reports/SEC filings & investor presentations; and learning the demand and supply-side analysis for the Inventory Tags Market.

The primary research activity included telephonic conversations with more than 50 tier 1 industry consultants, distributors, and end-use product manufacturers.

Finally, based on the above thorough research process, an in-depth analysis was carried out considering the following aspects: market attractiveness, current & future market trends, market share analysis, SWOT analysis of the company and customer analytics.

Frequently Asked Questions

This FREE sample includes market data points, ranging from trend analyses to market estimates & forecasts. See for yourself.
Or view our licence options:
Tailor made solutions just for you
80% of our clients seek made-to-order reports. How do you want us to tailor yours?
OUR CLIENTS


