This report was recently updated on April 14 2025 with the latest and most recent
market numbers
Global Spatial Proteomics Market Size, Trends & Analysis - Forecasts to 2030 By Product (Instruments, Consumables, and Software), By Technology (Imaging-based Technologies, Mass Spectrometry-based Technologies, Sequencing-based Technologies, and Others), By Workflow (Sample Preparation, Instrumental Analysis, and Data Analysis), By Sample Type (FFPE and Fresh Frozen), By End-use (Academic & Translational Research Institutes, Pharmaceutical and Biotechnology Companies, and Others), and By Region (North America, Asia Pacific, Central and South America, Europe, and Middle East and Africa), Competitive Landscape, Company Market Share Analysis, and End User Analysis
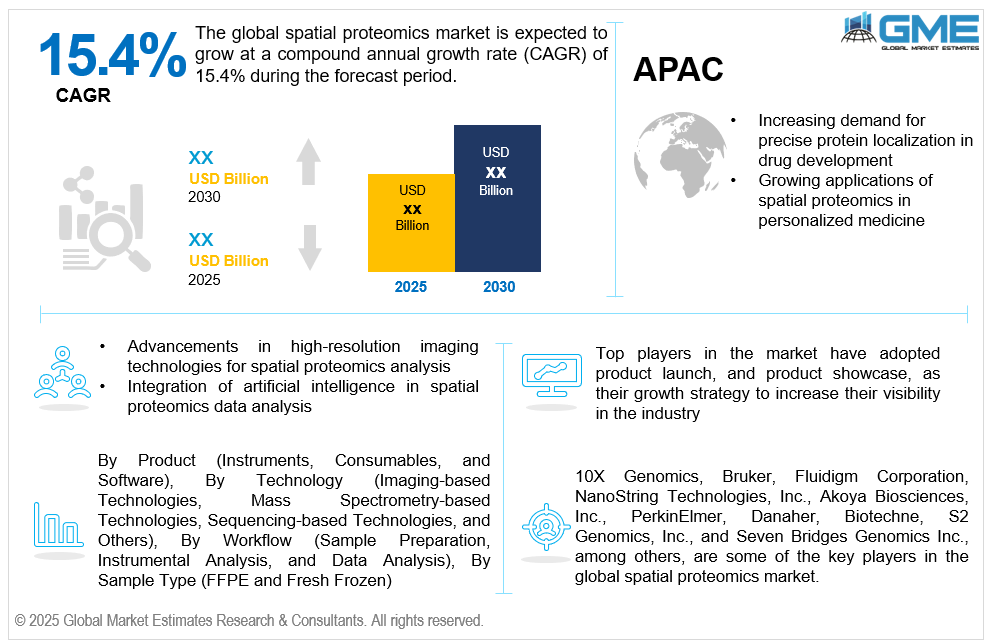
The global spatial proteomics market is estimated to exhibit a CAGR of 15.4% from 2025 to 2030.
The primary factors propelling the market growth are the increasing demand for precise protein localization in drug development and the growing applications of spatial proteomics in personalized medicine. Understanding the spatial distribution of proteins within cells and tissues is critical for identifying disease-specific targets and developing more effective and targeted therapeutics. Traditional proteomics methods often overlook the spatial context of proteins, which can lead to incomplete or misleading insights. Spatial proteomics addresses this gap by enabling researchers to map proteins in their native environments, offering a more detailed understanding of cellular functions and interactions. This is especially valuable in oncology, immunology, and neurodegenerative disease research, where the spatial arrangement of proteins plays a crucial role in disease progression. As pharmaceutical companies aim to reduce late-stage drug development failures and improve precision medicine strategies, the adoption of spatial proteomics tools and technologies is rapidly growing.
Advancements in high-resolution imaging technologies for spatial proteomics analysis, along with the integration of artificial intelligence in spatial proteomics data analysis, are expected to support the market growth. Techniques such as imaging mass spectrometry, multiplexed ion beam imaging (MIBI), and cyclic immunofluorescence now allow researchers to visualize and quantify proteins at subcellular resolution across complex tissue samples. These innovations enable the detailed mapping of protein expression and interaction within the spatial context of tissues, which is crucial for understanding disease mechanisms and cellular heterogeneity. High-resolution imaging facilitates more accurate biomarker discovery and enhances the ability to identify therapeutic targets, especially in complex diseases like cancer and neurological disorders. Additionally, improvements in imaging speed, sensitivity, and multiplexing capabilities have expanded the throughput and scalability of spatial proteomics studies. These technological leaps are attracting substantial interest from pharmaceutical and biotechnology companies, as well as academic research institutions, thereby fueling market demand.
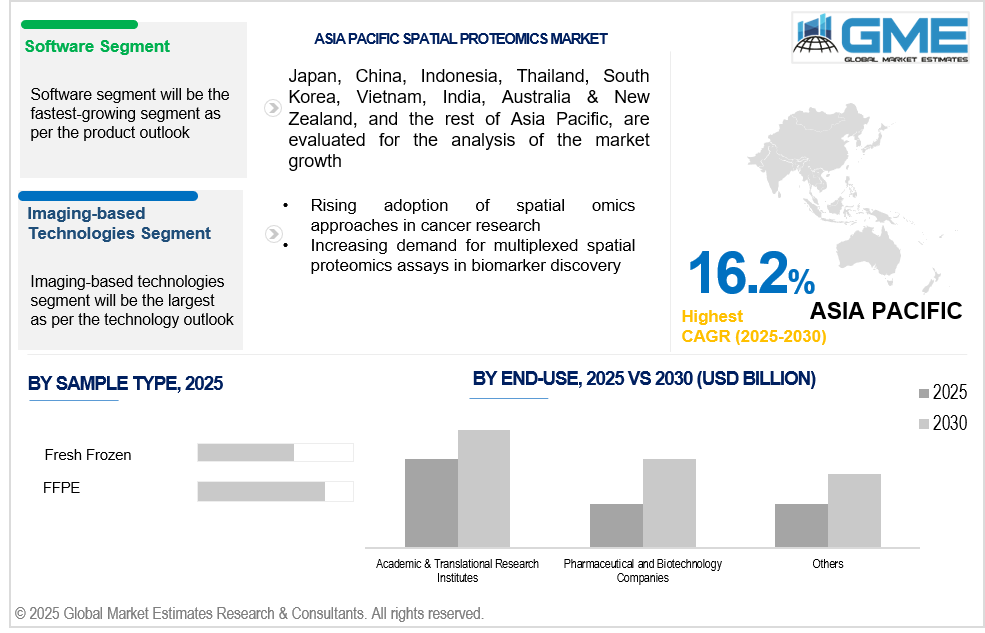
The rising adoption of spatial omics approaches in cancer research, coupled with the increasing demand for multiplexed spatial proteomics assays in biomarker discovery, propels market growth. Spatial proteomics allows researchers to study this complexity by analyzing the precise localization and abundance of proteins within tumor tissues. When combined with other spatial omics methods, such as spatial transcriptomics, scientists gain a multidimensional view of tumor biology, which is essential for uncovering new biomarkers, understanding tumor progression, and developing personalized therapies. This integrative approach is becoming increasingly popular in oncology, as it supports more informed clinical decision-making and targeted treatment strategies. Moreover, leading cancer research institutions and pharmaceutical companies are investing heavily in spatial omics platforms, creating new opportunities for technology providers and boosting the demand for spatial proteomics tools and services. This trend continues to accelerate the market's growth trajectory.
With the growing need for cellular-level insights, there is an opportunity to integrate spatial proteomics with single-cell analysis, offering a deeper understanding of cellular functions and heterogeneity, particularly in immunology and developmental biology. Additionally, there is a growing opportunity to use artificial intelligence and machine learning to interpret complex spatial proteomics data, enabling faster analysis, pattern recognition, and prediction of disease pathways, thereby enhancing research productivity and insights. However, the absence of standardized workflows across platforms and the high cost of spatial proteomics instruments impede market growth.
The consumables segment is expected to hold the largest share of the market over the forecast period. Consumables such as reagents, antibodies, and slides are used in every spatial proteomics experiment, leading to continuous and high-volume demand. Unlike instruments, which are one-time investments, consumables require frequent repurchasing, ensuring a consistent revenue stream and market dominance.
The software segment is expected to be the fastest-growing segment in the market from 2025 to 2030. Spatial proteomics generates vast and highly complex datasets that require advanced software for visualization, integration, and interpretation. As data complexity increases, so does the demand for intelligent, scalable analytical software, making this segment grow faster than hardware or consumables.
The imaging-based technologies segment is expected to hold the largest share of the market over the forecast period. Imaging-based technologies like immunofluorescence and imaging mass cytometry offer superior spatial resolution, enabling precise localization of proteins within tissues. This precision is critical for understanding cellular microenvironments, making imaging platforms the preferred choice for many spatial proteomics applications globally.
The sequencing-based technologies segment is anticipated to be the fastest-growing segment in the market from 2025 to 2030. Advancements in sequencing chemistry and barcoding techniques now allow highly sensitive detection of protein expression at spatial resolution. These innovations are enhancing data accuracy and resolution, attracting greater research attention, and accelerating the growth of sequencing-based technologies in the market.
The instrumental analysis segment is expected to hold the largest share of the market over the forecast period. Instrumental analysis forms the backbone of spatial proteomics workflows, involving critical tools like mass spectrometers, imaging systems, and automated microscopes. These instruments are essential for protein detection and localization, ensuring that this segment dominates in terms of both value and volume.
The sample preparation segment is anticipated to be the fastest-growing segment in the market from 2025 to 2030. As spatial proteomics expands into complex tissues like tumors and the brain, more intricate sample preparation methods are required. These techniques must preserve spatial integrity and protein localization, increasing demand for advanced reagents and protocols, thus driving rapid segment growth.
The FFPE segment is expected to hold the largest share of the market over the forecast period. Imaging-based technologies like immunofluorescence and imaging mass cytometry offer superior spatial resolution, enabling precise localization of proteins within tissues. This precision is critical for understanding cellular microenvironments, making imaging platforms the preferred choice for many spatial proteomics applications globally.
The fresh frozen segment is anticipated to be the fastest-growing segment in the market from 2025 to 2030. Fresh frozen samples are preferred in cutting-edge areas like neurobiology and immunology due to their compatibility with high-resolution and highly multiplexed protein profiling. As these fields expand spatial analyses, fresh frozen tissue use is growing quickly across leading laboratories.
The academic & translational research institutes segment is expected to hold the largest share of the market over the forecast period. Academic and translational institutes drive much of the innovation in spatial proteomics by exploring novel methods, validating technologies, and publishing foundational studies. Their pioneering role attracts significant funding and tool deployment, making them the dominant contributors to market demand.
The pharmaceutical and biotechnology companies segment is anticipated to be the fastest-growing segment in the market from 2025 to 2030. Pharmaceutical and biotechnology companies are increasingly utilizing spatial proteomics to understand the complex tissue microenvironment and to identify novel drug targets. This growing focus on precision medicine is driving rapid adoption of spatial proteomics tools, making the segment grow faster.
North America is expected to be the largest region in the global market. North America, especially the U.S., is home to world-leading research institutions, universities, and biotech companies that heavily invest in spatial proteomics. These entities drive innovation and adoption of cutting-edge technologies, ensuring the region’s dominant position in the market.
Asia Pacific is anticipated to witness rapid growth during the forecast period. Countries in the Asia Pacific region are increasingly adopting precision medicine to treat complex diseases like cancer, neurological disorders, and cardiovascular conditions. Spatial proteomics is a key tool in this approach, driving demand for these technologies in the region.
10X Genomics, Bruker, Fluidigm Corporation, NanoString Technologies, Inc., Akoya Biosciences, Inc., PerkinElmer, Danaher, Biotechne, S2 Genomics, Inc., and Seven Bridges Genomics Inc., among others, are some of the key players in the global spatial proteomics market.
Please note: This is not an exhaustive list of companies profiled in the report.
In October 2024, Beckman Coulter Life Sciences and 10x Genomics collaborated to enhance automation for single-cell test procedures.
In September 2024, to support clinical research initiatives, Bio-Techne Corporation's Lunaphore spatial biology brand announced a collaboration with Discovery Life Sciences to launch their spatial biology platform, COMET.
REPORT CONTENT
1 STRATEGIC INSIGHTS ON NEW REVENUE POCKETS
1.1 Strategic Opportunity & Attractiveness Analysis
1.1.1 Hot Revenue Pockets
1.1.2 Market Attractiveness Score
1.1.3 Revenue Impacting Opportunity
1.1.4 High Growing Region/Country
1.1.5 Competitor Analysis
1.1.6 Consumer Analysis
1.2 Global Market Estimates' View
1.3 Strategic Insights across Business Functions
1.3.1 For Chief Executive Officers
1.3.2 For Chief Marketing Officers
1.3.3 For Chief Strategy Officers
1.4 Evaluate the Potential of your Existing Business Lines vs. New Lines to Enter Into
2 TECHNOLOGICAL TRENDS
2.1 Technological Adoption Rate
2.2 Current Trend Impact Analysis
2.3 Future Trend Impact Analysis
2.4 Data Metrics
3 GLOBAL MARKET OUTLOOK
3.1 Market Pyramid Analysis
3.1.1 Introduction
3.1.2 Adjacent Market Opportunities
3.1.3 Ancillary Market Opportunities
3.2 Demand Side Analysis
3.2.1 Market Drivers: Impact Analysis
3.2.2 Market Restraints: Impact Analysis
3.2.3 Market Opportunities: Impact Analysis
3.2.4 Market Challenges: Impact Analysis
3.3 Supply Side Analysis
3.3.1 Porter’s Five Forces Analysis
3.3.1.1 Threat of New Entrants
3.3.1.2 Threat of New Substitutes
3.3.1.3 Bargaining Power of Suppliers
3.3.1.4 Bargaining Power of Buyers
3.3.1.5 Intensity of Competitive Rivalry
3.3.2 SWOT Analysis; By Factor (Political & Legal, Economic, and Technological)
3.3.2.1 Political Landscape
3.3.2.2 Economic Landscape
3.3.2.3 Social Landscape
3.3.2.4 Workflow Landscape
3.3.3 Value Chain Analysis
3.3.4 Trend Analysis
3.3.5 Gap Analysis
3.3.6 Cost Analysis
4 GLOBAL SPATIAL PROTEOMICS MARKET, BY PRODUCT
4.1 Introduction
4.2 Spatial Proteomics Market: Product Scope Key Takeaways
4.3 Revenue Growth Analysis, 2024 & 2030
4.4 Instruments
4.4.1 Instruments Market Estimates and Forecast, 2022-2030 (USD Million)
4.5 Consumables
4.5.1 Consumables Market Estimates and Forecast, 2022-2030 (USD Million)
4.6 Software
4.6.1 Software Market Estimates and Forecast, 2022-2030 (USD Million)
5 GLOBAL SPATIAL PROTEOMICS MARKET, BY TECHNOLOGY
5.1 Introduction
5.2 Spatial Proteomics Market: Technology Scope Key Takeaways
5.3 Revenue Growth Analysis, 2024 & 2030
5.4 Imaging-based Technologies
5.4.1 Imaging-based Technologies Market Estimates and Forecast, 2022-2030 (USD Million)
5.5 Mass Spectrometry-based Technologies
5.5.1 Mass Spectrometry-based Technologies Market Estimates and Forecast, 2022-2030 (USD Million)
5.6 Sequencing-based Technologies
5.6.1 Sequencing-based Technologies Market Estimates and Forecast, 2022-2030 (USD Million)
5.7 Others
5.7.1 Others Market Estimates and Forecast, 2022-2030 (USD Million)
6 GLOBAL SPATIAL PROTEOMICS MARKET, BY SAMPLE TYPE
6.1 Introduction
6.2 Spatial Proteomics Market: Sample Type Scope Key Takeaways
6.3 Revenue Growth Analysis, 2024 & 2030
6.4 FFPE
6.4.1 FFPE Market Estimates and Forecast, 2022-2030 (USD Million)
6.5 Fresh Frozen
6.5.1 Fresh Frozen Market Estimates and Forecast, 2022-2030 (USD Million)
7 GLOBAL SPATIAL PROTEOMICS MARKET, BY WORKFLOW
7.1 Introduction
7.2 Spatial Proteomics Market: Workflow Scope Key Takeaways
7.3 Revenue Growth Analysis, 2024 & 2030
7.4 Sample Preparation
7.4.1 Sample Preparation Market Estimates and Forecast, 2022-2030 (USD Million)
7.5 Instrumental Analysis
7.5.1 Instrumental Analysis Market Estimates and Forecast, 2022-2030 (USD Million)
7.6 Data Analysis
7.6.1 Data Analysis Market Estimates and Forecast, 2022-2030 (USD Million)
8 GLOBAL SPATIAL PROTEOMICS MARKET, BY END-USE
8.1 Introduction
8.2 Spatial Proteomics Market: End-use Scope Key Takeaways
8.3 Revenue Growth Analysis, 2024 & 2030
8.4 Academic & Translational Research Institutes
8.4.1 Academic & Translational Research Institutes Market Estimates and Forecast, 2022-2030 (USD Million)
8.5 Pharmaceutical and Biotechnology Companies
8.5.1 Pharmaceutical and Biotechnology Companies Market Estimates and Forecast, 2022-2030 (USD Million)
8.6 Others
8.6.1 Others Market Estimates and Forecast, 2022-2030 (USD Million)
9 GLOBAL SPATIAL PROTEOMICS MARKET, BY REGION
9.1 Introduction
9.2 North America Spatial Proteomics Market Estimates and Forecast, 2022-2030 (USD Million)
9.2.1 By Product
9.2.2 By Technology
9.2.3 By Sample Type
9.2.4 By Workflow
9.2.5 By End-use
9.2.6 By Country
9.2.6.1 U.S. Spatial Proteomics Market Estimates and Forecast, 2022-2030 (USD Million)
9.2.6.1.1 By Product
9.2.6.1.2 By Technology
9.2.6.1.3 By Sample Type
9.2.6.1.4 By Workflow
9.2.6.1.5 By End-use
9.2.6.2 Canada Spatial Proteomics Market Estimates and Forecast, 2022-2030 (USD Million)
9.2.6.2.1 By Product
9.2.6.2.2 By Technology
9.2.6.2.3 By Sample Type
9.2.6.2.4 By Workflow
9.2.6.2.5 By End-use
9.2.6.3 Mexico Spatial Proteomics Market Estimates and Forecast, 2022-2030 (USD Million)
9.2.6.3.1 By Product
9.2.6.3.2 By Technology
9.2.6.3.3 By Sample Type
9.2.6.3.4 By Workflow
9.2.6.3.5 By End-use
9.3 Europe Spatial Proteomics Market Estimates and Forecast, 2022-2030 (USD Million)
9.3.1 By Product
9.3.2 By Technology
9.3.3 By Sample Type
9.3.4 By Workflow
9.3.5 By End-use
9.3.6 By Country
9.3.6.1 Germany Spatial Proteomics Market Estimates and Forecast, 2022-2030 (USD Million)
9.3.6.1.1 By Product
9.3.6.1.2 By Technology
9.3.6.1.3 By Sample Type
9.3.6.1.4 By Workflow
9.3.6.1.5 By End-use
9.3.6.2 U.K. Spatial Proteomics Market Estimates and Forecast, 2022-2030 (USD Million)
9.3.6.2.1 By Product
9.3.6.2.2 By Technology
9.3.6.2.3 By Sample Type
9.3.6.2.4 By Workflow
9.3.6.2.5 By End-use
9.3.6.3 France Spatial Proteomics Market Estimates and Forecast, 2022-2030 (USD Million)
9.3.6.3.1 By Product
9.3.6.3.2 By Technology
9.3.6.3.3 By Sample Type
9.3.6.3.4 By Workflow
9.3.6.3.5 By End-use
9.3.6.4 Italy Spatial Proteomics Market Estimates and Forecast, 2022-2030 (USD Million)
9.3.6.4.1 By Product
9.3.6.4.2 By Technology
9.3.6.4.3 By Sample Type
9.3.6.4.4 By Workflow
9.3.6.4.5 By End-use
9.3.6.5 Spain Spatial Proteomics Market Estimates and Forecast, 2022-2030 (USD Million)
9.3.6.5.1 By Product
9.3.6.5.2 By Technology
9.3.6.5.3 By Sample Type
9.3.6.5.4 By Workflow
9.3.6.5.5 By End-use
9.3.6.6 Netherlands Spatial Proteomics Market Estimates and Forecast, 2022-2030 (USD Million)
9.3.6.6.1 By Product
9.3.6.6.2 By Technology
9.3.6.6.3 By Sample Type
9.3.6.6.4 By Workflow
9.3.6.6.5 By End-use
9.3.6.7 Rest of Europe Spatial Proteomics Market Estimates and Forecast, 2022-2030 (USD Million)
9.3.6.7.1 By Product
9.3.6.7.2 By Technology
9.3.6.7.3 By Sample Type
9.3.6.7.4 By Workflow
9.3.6.7.5 By End-use
9.4 Asia Pacific Spatial Proteomics Market Estimates and Forecast, 2022-2030 (USD Million)
9.4.1 By Product
9.4.2 By Technology
9.4.3 By Sample Type
9.4.4 By Workflow
9.4.5 By End-use
9.4.6 By Country
9.4.6.1 China Spatial Proteomics Market Estimates and Forecast, 2022-2030 (USD Million)
9.4.6.1.1 By Product
9.4.6.1.2 By Technology
9.4.6.1.3 By Sample Type
9.4.6.1.4 By Workflow
9.4.6.1.5 By End-use
9.4.6.2 Japan Spatial Proteomics Market Estimates and Forecast, 2022-2030 (USD Million)
9.4.6.2.1 By Product
9.4.6.2.2 By Technology
9.4.6.2.3 By Sample Type
9.4.6.2.4 By Workflow
9.4.6.2.5 By End-use
9.4.6.3 India Spatial Proteomics Market Estimates and Forecast, 2022-2030 (USD Million)
9.4.6.3.1 By Product
9.4.6.3.2 By Technology
9.4.6.3.3 By Sample Type
9.4.6.3.4 By Workflow
9.4.6.3.5 By End-use
9.4.6.4 South Korea Spatial Proteomics Market Estimates and Forecast, 2022-2030 (USD Million)
9.4.6.4.1 By Product
9.4.6.4.2 By Technology
9.4.6.4.3 By Sample Type
9.4.6.4.4 By Workflow
9.4.6.4.5 By End-use
9.4.6.5 Singapore Spatial Proteomics Market Estimates and Forecast, 2022-2030 (USD Million)
9.4.6.5.1 By Product
9.4.6.5.2 By Technology
9.4.6.5.3 By Sample Type
9.4.6.5.4 By Workflow
9.4.6.5.5 By End-use
9.4.6.6 Malaysia Spatial Proteomics Market Estimates and Forecast, 2022-2030 (USD Million)
9.4.6.6.1 By Product
9.4.6.6.2 By Technology
9.4.6.6.3 By Sample Type
9.4.6.6.4 By Workflow
9.4.6.6.5 By End-use
9.4.6.7 Thailand Spatial Proteomics Market Estimates and Forecast, 2022-2030 (USD Million)
9.4.6.7.1 By Product
9.4.6.7.2 By Technology
9.4.6.7.3 By Sample Type
9.4.6.7.4 By Workflow
9.4.6.7.5 By End-use
9.4.6.8 Indonesia Spatial Proteomics Market Estimates and Forecast, 2022-2030 (USD Million)
9.4.6.8.1 By Product
9.4.6.8.2 By Technology
9.4.6.8.3 By Sample Type
9.4.6.8.4 By Workflow
9.4.6.8.5 By End-use
9.4.6.9 Vietnam Spatial Proteomics Market Estimates and Forecast, 2022-2030 (USD Million)
9.4.6.9.1 By Product
9.4.6.9.2 By Technology
9.4.6.9.3 By Sample Type
9.4.6.9.4 By Workflow
9.4.6.9.5 By End-use
9.4.6.10 Taiwan Spatial Proteomics Market Estimates and Forecast, 2022-2030 (USD Million)
9.4.6.10.1 By Product
9.4.6.10.2 By Technology
9.4.6.10.3 By Sample Type
9.4.6.10.4 By Workflow
9.4.6.10.5 By End-use
9.4.6.11 Rest of Asia Pacific Spatial Proteomics Market Estimates and Forecast, 2022-2030 (USD Million)
9.4.6.11.1 By Product
9.4.6.11.2 By Technology
9.4.6.11.3 By Sample Type
9.4.6.11.4 By Workflow
9.4.6.11.5 By End-use
9.5 Middle East and Africa Spatial Proteomics Market Estimates and Forecast, 2022-2030 (USD Million)
9.5.1 By Product
9.5.2 By Technology
9.5.3 By Sample Type
9.5.4 By Workflow
9.5.5 By End-use
9.5.6 By Country
9.5.6.1 Saudi Arabia Spatial Proteomics Market Estimates and Forecast, 2022-2030 (USD Million)
9.5.6.1.1 By Product
9.5.6.1.2 By Technology
9.5.6.1.3 By Sample Type
9.5.6.1.4 By Workflow
9.5.6.1.5 By End-use
9.5.6.2 U.A.E. Spatial Proteomics Market Estimates and Forecast, 2022-2030 (USD Million)
9.5.6.2.1 By Product
9.5.6.2.2 By Technology
9.5.6.2.3 By Sample Type
9.5.6.2.4 By Workflow
9.5.6.12.5 By End-use
9.5.6.3 Israel Spatial Proteomics Market Estimates and Forecast, 2022-2030 (USD Million)
9.5.4.3.1 By Product
9.5.4.3.2 By Technology
9.5.4.3.3 By Sample Type
9.5.6.3.4 By Workflow
9.5.6.3.5 By End-use
9.5.6.4 South Africa Spatial Proteomics Market Estimates and Forecast, 2022-2030 (USD Million)
9.5.6.4.1 By Product
9.5.6.4.2 By Technology
9.5.6.4.3 By Sample Type
9.5.6.4.4 By Workflow
9.5.6.4.5 By End-use
9.5.6.5 Rest of Middle East and Africa Spatial Proteomics Market Estimates and Forecast, 2022-2030 (USD Million)
9.5.6.5.1 By Product
9.5.6.5.2 By Technology
9.5.6.5.2 By Sample Type
9.5.6.5.4 By Workflow
9.5.6.5.5 By End-use
9.6 Central & South America Spatial Proteomics Market Estimates and Forecast, 2022-2030 (USD Million)
9.6.1 By Product
9.6.2 By Technology
9.6.3 By Sample Type
9.6.4 By Workflow
9.6.5 By End-use
9.6.6 By Country
9.6.6.1 Brazil Spatial Proteomics Market Estimates and Forecast, 2022-2030 (USD Million)
9.6.6.1.1 By Product
9.6.6.1.2 By Technology
9.6.6.1.3 By Sample Type
9.6.6.1.4 By Workflow
9.6.6.1.5 By End-use
9.6.6.2 Argentina Spatial Proteomics Market Estimates and Forecast, 2022-2030 (USD Million)
9.6.6.2.1 By Product
9.6.6.2.2 By Technology
9.6.6.2.3 By Sample Type
9.6.6.2.4 By Workflow
9.6.6.2.5 By End-use
9.6.6.3 Chile Spatial Proteomics Market Estimates and Forecast, 2022-2030 (USD Million)
9.6.6.3.1 By Product
9.6.6.3.2 By Technology
9.6.6.3.3 By Sample Type
9.6.6.3.4 By Workflow
9.6.6.3.5 By End-use
9.6.6.4 Rest of Central & South America Spatial Proteomics Market Estimates and Forecast, 2022-2030 (USD Million)
9.6.6.4.1 By Product
9.6.6.4.2 By Technology
9.6.6.4.3 By Sample Type
9.6.6.4.4 By Workflow
9.6.6.4.5 By End-use
10 COMPETITIVE LANDCAPE
10.1 Company Market Share Analysis
10.2 Four Quadrant Positioning Matrix
10.2.1 Market Leaders
10.2.2 Market Visionaries
10.2.3 Market Challengers
10.2.4 Niche Market Players
10.3 Vendor Landscape
10.3.1 North America
10.3.2 Europe
10.3.3 Asia Pacific
10.3.4 Rest of the World
10.4 Company Profiles
10.4.1 10X Genomics
10.4.1.1 Business Description & Financial Analysis
10.4.1.2 SWOT Analysis
10.4.1.3 Poducts & Services Offered
10.4.1.4 Strategic Alliances between Business Partners
10.4.2 Bruker
10.4.2.1 Business Description & Financial Analysis
10.4.2.2 SWOT Analysis
10.4.2.3 Poducts & Services Offered
10.4.2.4 Strategic Alliances between Business Partners
10.4.3 Fluidigm Corporation
10.4.3.1 Business Description & Financial Analysis
10.4.3.2 SWOT Analysis
10.4.3.3 Poducts & Services Offered
10.4.3.4 Strategic Alliances between Business Partners
10.4.4 NanoString Technologies, Inc.
10.4.4.1 Business Description & Financial Analysis
10.4.4.2 SWOT Analysis
10.4.4.3 Poducts & Services Offered
10.4.4.4 Strategic Alliances between Business Partners
10.4.5 Akoya Biosciences, Inc.
10.4.5.1 Business Description & Financial Analysis
10.4.5.2 SWOT Analysis
10.4.5.3 Poducts & Services Offered
10.4.5.4 Strategic Alliances between Business Partners
10.4.6 PERKINELMER
10.4.6.1 Business Description & Financial Analysis
10.4.6.2 SWOT Analysis
10.4.6.3 Poducts & Services Offered
10.4.6.4 Strategic Alliances between Business Partners
10.4.7 Danaher
10.4.7.1 Business Description & Financial Analysis
10.4.7.2 SWOT Analysis
10.4.7.3 Poducts & Services Offered
10.4.7.4 Strategic Alliances between Business Partners
10.4.8 Biotechne
10.4.8.1 Business Description & Financial Analysis
10.4.8.2 SWOT Analysis
10.4.8.3 Poducts & Services Offered
10.4.8.4 Strategic Alliances between Business Partners
10.4.9 S2 Genomics, Inc.
10.4.9.1 Business Description & Financial Analysis
10.4.9.2 SWOT Analysis
10.4.9.3 Poducts & Services Offered
10.4.9.4 Strategic Alliances between Business Partners
10.4.10 Seven Bridges Genomics Inc.
10.4.10.1 Business Description & Financial Analysis
10.4.10.2 SWOT Analysis
10.4.10.3 Poducts & Services Offered
10.4.10.4 Strategic Alliances between Business Partners
10.4.11 Other Companies
10.4.11.1 Business Description & Financial Analysis
10.4.11.2 SWOT Analysis
10.4.11.3 Poducts & Services Offered
10.4.11.4 Strategic Alliances between Business Partners
11 RESEARCH METHODOLOGY
11.1 Market Introduction
11.1.1 Market Definition
11.1.2 Market Scope & Segmentation
11.2 Information Procurement
11.2.1 Secondary Research
11.2.1.1 Purchased Databases
11.2.1.2 GMEs Internal Data Repository
11.2.1.3 Secondary Resources & Third Party Perspectives
11.2.1.4 Company Information Sources
11.2.2 Primary Research
11.2.2.1 Various Types of Respondents for Primary Interviews
11.2.2.2 Number of Interviews Conducted throughout the Research Process
11.2.2.3 Primary Stakeholders
11.2.2.4 Discussion Guide for Primary Participants
11.2.3 Expert Panels
11.2.3.1 Expert Panels Across 30+ Industry
11.2.4 Paid Local Experts
11.2.4.1 Paid Local Experts Across 30+ Industry Across each Region
11.3 Market Estimation
11.3.1 Top-Down Approach
11.3.1.1 Macro-Economic Indicators Considered
11.3.1.2 Micro-Economic Indicators Considered
11.3.2 Bottom Up Approach
11.3.2.1 Company Share Analysis Approach
11.3.2.2 Estimation of Potential End-use Sales
11.4 Data Triangulation
11.4.1 Data Collection
11.4.2 Time Series, Cross Sectional & Panel Data Analysis
11.4.3 Cluster Analysis
11.5 Analysis and Output
11.5.1 Inhouse AI Based Real Time Analytics Tool
11.5.2 Output From Desk & Primary Research
11.6 Research Assumptions & Limitations
11.7.1 Research Assumptions
11.7.2 Research Limitations
LIST OF TABLES
1 Global Spatial Proteomics Market, By Product, 2022-2030 (USD Mllion)
2 Instruments Market, By Region, 2022-2030 (USD Mllion)
3 Consumables Market, By Region, 2022-2030 (USD Mllion)
4 Software Market, By Region, 2022-2030 (USD Mllion)
5 Global Spatial Proteomics Market, By Technology, 2022-2030 (USD Mllion)
6 Imaging-based Technologies Market, By Region, 2022-2030 (USD Mllion)
7 Mass Spectrometry-based Technologies Market, By Region, 2022-2030 (USD Mllion)
8 Sequencing-based Technologies Market, By Region, 2022-2030 (USD Mllion)
9 Others Market, By Region, 2022-2030 (USD Mllion)
10 Global Spatial Proteomics Market, By Sample Type, 2022-2030 (USD Mllion)
11 FFPE Market, By Region, 2022-2030 (USD Mllion)
12 Fresh Frozen Market, By Region, 2022-2030 (USD Mllion)
13 Global Spatial Proteomics Market, By WORKFLOW, 2022-2030 (USD Mllion)
14 Sample Preparation Market, By Region, 2022-2030 (USD Mllion)
15 Instrumental Analysis Market, By Region, 2022-2030 (USD Mllion)
16 Data Analysis Market, By Region, 2022-2030 (USD Mllion)
17 Global Spatial Proteomics Market, By End-use, 2022-2030 (USD Mllion)
18 Academic & Translational Research Institutes Market, By Region, 2022-2030 (USD Mllion)
19 Pharmaceutical and Biotechnology Companies Market, By Region, 2022-2030 (USD Mllion)
20 Others Market, By Region, 2022-2030 (USD Mllion)
21 Regional Analysis, 2022-2030 (USD Mllion)
22 North America Spatial Proteomics Market, By Product, 2022-2030 (USD Million)
23 North America Spatial Proteomics Market, By Technology, 2022-2030 (USD Million)
24 North America Spatial Proteomics Market, By Sample Type, 2022-2030 (USD Million)
25 North America Spatial Proteomics Market, By Workflow, 2022-2030 (USD Million)
26 North America Spatial Proteomics Market, By END-USE, 2022-2030 (USD Million)
27 North America Spatial Proteomics Market, By Country, 2022-2030 (USD Million)
28 U.S. Spatial Proteomics Market, By Product, 2022-2030 (USD Million)
29 U.S. Spatial Proteomics Market, By Technology, 2022-2030 (USD Million)
30 U.S. Spatial Proteomics Market, By Sample Type, 2022-2030 (USD Million)
31 U.S. Spatial Proteomics Market, By Workflow, 2022-2030 (USD Million)
32 U.S. America Spatial Proteomics Market, By END-USE, 2022-2030 (USD Million)
33 Canada Spatial Proteomics Market, By Product, 2022-2030 (USD Million)
34 Canada Spatial Proteomics Market, By Technology, 2022-2030 (USD Million)
35 Canada Spatial Proteomics Market, By Sample Type, 2022-2030 (USD Million)
36 CANADA Spatial Proteomics Market, By Workflow, 2022-2030 (USD Million)
37 CANADA Spatial Proteomics Market, By END-USE, 2022-2030 (USD Million)
38 Mexico Spatial Proteomics Market, By Product, 2022-2030 (USD Million)
39 Mexico Spatial Proteomics Market, By Technology, 2022-2030 (USD Million)
40 Mexico Spatial Proteomics Market, By Sample Type, 2022-2030 (USD Million)
41 mexico Spatial Proteomics Market, By Workflow, 2022-2030 (USD Million)
42 MEXICO Spatial Proteomics Market, By END-USE, 2022-2030 (USD Million)
43 Europe Spatial Proteomics Market, By Product, 2022-2030 (USD Million)
44 Europe Spatial Proteomics Market, By Technology, 2022-2030 (USD Million)
45 Europe Spatial Proteomics Market, By Sample Type, 2022-2030 (USD Million)
46 europe Spatial Proteomics Market, By Workflow, 2022-2030 (USD Million)
47 EUROPE Spatial Proteomics Market, By END-USE, 2022-2030 (USD Million)
48 EUROPE Spatial Proteomics Market, By COUNTRY, 2022-2030 (USD Million)
49 Germany Spatial Proteomics Market, By Product, 2022-2030 (USD Million)
50 Germany Spatial Proteomics Market, By Technology, 2022-2030 (USD Million)
51 Germany Spatial Proteomics Market, By Sample Type, 2022-2030 (USD Million)
52 germany Spatial Proteomics Market, By Workflow, 2022-2030 (USD Million)
53 GERMANY Spatial Proteomics Market, By END-USE, 2022-2030 (USD Million)
54 UK Spatial Proteomics Market, By Product, 2022-2030 (USD Million)
55 UK Spatial Proteomics Market, By Technology, 2022-2030 (USD Million)
56 UK Spatial Proteomics Market, By Sample Type, 2022-2030 (USD Million)
57 U.k Spatial Proteomics Market, By Workflow, 2022-2030 (USD Million)
58 U.K Spatial Proteomics Market, By END-USE, 2022-2030 (USD Million)
59 France Spatial Proteomics Market, By Product, 2022-2030 (USD Million)
60 France Spatial Proteomics Market, By Technology, 2022-2030 (USD Million)
61 France Spatial Proteomics Market, By Sample Type, 2022-2030 (USD Million)
62 france Spatial Proteomics Market, By Workflow, 2022-2030 (USD Million)
63 FRANCE Spatial Proteomics Market, By END-USE, 2022-2030 (USD Million)
64 Italy Spatial Proteomics Market, By Product, 2022-2030 (USD Million)
65 Italy Spatial Proteomics Market, By Technology, 2022-2030 (USD Million)
66 Italy Spatial Proteomics Market, By Sample Type, 2022-2030 (USD Million)
67 italy Spatial Proteomics Market, By Workflow, 2022-2030 (USD Million)
68 ITALY Spatial Proteomics Market, By END-USE, 2022-2030 (USD Million)
69 Spain Spatial Proteomics Market, By Product, 2022-2030 (USD Million)
70 Spain Spatial Proteomics Market, By Technology, 2022-2030 (USD Million)
71 Spain Spatial Proteomics Market, By Sample Type, 2022-2030 (USD Million)
72 spain Spatial Proteomics Market, By Workflow, 2022-2030 (USD Million)
73 SPAIN Spatial Proteomics Market, By END-USE, 2022-2030 (USD Million)
74 NETHERLANDS Spatial Proteomics Market, By Product, 2022-2030 (USD Million)
75 NETHERLANDS Spatial Proteomics Market, By Technology, 2022-2030 (USD Million)
76 NETHERLANDS Spatial Proteomics Market, By Sample Type, 2022-2030 (USD Million)
77 NETHERLANDS Spatial Proteomics Market, By Workflow, 2022-2030 (USD Million)
78 NETHERLANDS Spatial Proteomics Market, By END-USE, 2022-2030 (USD Million)
79 Rest Of Europe Spatial Proteomics Market, By Product, 2022-2030 (USD Million)
80 Rest Of Europe Spatial Proteomics Market, By Technology, 2022-2030 (USD Million)
81 Rest of Europe Spatial Proteomics Market, By Sample Type, 2022-2030 (USD Million)
82 REST OF EUROPE Spatial Proteomics Market, By Workflow, 2022-2030 (USD Million)
83 REST OF EUROPE Spatial Proteomics Market, By END-USE, 2022-2030 (USD Million)
84 Asia Pacific Spatial Proteomics Market, By Product, 2022-2030 (USD Million)
85 Asia Pacific Spatial Proteomics Market, By Technology, 2022-2030 (USD Million)
86 Asia Pacific Spatial Proteomics Market, By Sample Type, 2022-2030 (USD Million)
87 asia Spatial Proteomics Market, By Workflow, 2022-2030 (USD Million)
88 ASIA PACIFIC Spatial Proteomics Market, By END-USE, 2022-2030 (USD Million)
89 Asia Pacific Spatial Proteomics Market, By Country, 2022-2030 (USD Million)
90 China Spatial Proteomics Market, By Product, 2022-2030 (USD Million)
91 China Spatial Proteomics Market, By Technology, 2022-2030 (USD Million)
92 China Spatial Proteomics Market, By Sample Type, 2022-2030 (USD Million)
93 china Spatial Proteomics Market, By Workflow, 2022-2030 (USD Million)
94 CHINA Spatial Proteomics Market, By END-USE, 2022-2030 (USD Million)
95 India Spatial Proteomics Market, By Product, 2022-2030 (USD Million)
96 India Spatial Proteomics Market, By Technology, 2022-2030 (USD Million)
97 India Spatial Proteomics Market, By Sample Type, 2022-2030 (USD Million)
98 india Spatial Proteomics Market, By Workflow, 2022-2030 (USD Million)
99 INDIA Spatial Proteomics Market, By END-USE, 2022-2030 (USD Million)
100 Japan Spatial Proteomics Market, By Product, 2022-2030 (USD Million)
101 Japan Spatial Proteomics Market, By Technology, 2022-2030 (USD Million)
102 Japan Spatial Proteomics Market, By Sample Type, 2022-2030 (USD Million)
103 japan Spatial Proteomics Market, By Workflow, 2022-2030 (USD Million)
104 JAPAN Spatial Proteomics Market, By END-USE, 2022-2030 (USD Million)
105 South Korea Spatial Proteomics Market, By Product, 2022-2030 (USD Million)
106 South Korea Spatial Proteomics Market, By Technology, 2022-2030 (USD Million)
107 South Korea Spatial Proteomics Market, By Sample Type, 2022-2030 (USD Million)
108 south korea Spatial Proteomics Market, By Workflow, 2022-2030 (USD Million)
109 SOUTH KOREA Spatial Proteomics Market, By END-USE, 2022-2030 (USD Million)
110 SINGAPORE Spatial Proteomics Market, By Product, 2022-2030 (USD Million)
111 SINGAPORE Spatial Proteomics Market, By Technology, 2022-2030 (USD Million)
112 SINGAPORE Spatial Proteomics Market, By Sample Type, 2022-2030 (USD Million)
113 SINGAPORE Spatial Proteomics Market, By Workflow, 2022-2030 (USD Million)
114 SINGAPORE Spatial Proteomics Market, By END-USE, 2022-2030 (USD Million)
115 Thailand Spatial Proteomics Market, By Product, 2022-2030 (USD Million)
116 Thailand Spatial Proteomics Market, By Technology, 2022-2030 (USD Million)
117 Thailand Spatial Proteomics Market, By Sample Type, 2022-2030 (USD Million)
118 Thailand Spatial Proteomics Market, By Workflow, 2022-2030 (USD Million)
119 THAILAND Spatial Proteomics Market, By END-USE, 2022-2030 (USD Million)
120 Malaysia Spatial Proteomics Market, By Product, 2022-2030 (USD Million)
121 Malaysia Spatial Proteomics Market, By Technology, 2022-2030 (USD Million)
122 Malaysia Spatial Proteomics Market, By Sample Type, 2022-2030 (USD Million)
123 Malaysia Spatial Proteomics Market, By Workflow, 2022-2030 (USD Million)
124 MALAYSIA Spatial Proteomics Market, By END-USE, 2022-2030 (USD Million)
125 Indonesia Spatial Proteomics Market, By Product, 2022-2030 (USD Million)
126 Indonesia Spatial Proteomics Market, By Technology, 2022-2030 (USD Million)
127 Indonesia Spatial Proteomics Market, By Sample Type, 2022-2030 (USD Million)
128 Indonesia Spatial Proteomics Market, By Workflow, 2022-2030 (USD Million)
129 INDONESIA Spatial Proteomics Market, By END-USE, 2022-2030 (USD Million)
130 VIETNAM Spatial Proteomics Market, By Product, 2022-2030 (USD Million)
131 VIETNAM Spatial Proteomics Market, By Technology, 2022-2030 (USD Million)
132 VIETNAM Spatial Proteomics Market, By Sample Type, 2022-2030 (USD Million)
133 VIETNAM Spatial Proteomics Market, By Workflow, 2022-2030 (USD Million)
134 VIETNAM Spatial Proteomics Market, By END-USE, 2022-2030 (USD Million)
135 Taiwan Spatial Proteomics Market, By Product, 2022-2030 (USD Million)
136 Taiwan Spatial Proteomics Market, By Technology, 2022-2030 (USD Million)
137 Taiwan Spatial Proteomics Market, By Sample Type, 2022-2030 (USD Million)
138 Taiwan Spatial Proteomics Market, By Workflow, 2022-2030 (USD Million)
139 TAIWAN Spatial Proteomics Market, By END-USE, 2022-2030 (USD Million)
140 Rest of APAC Spatial Proteomics Market, By Product, 2022-2030 (USD Million)
141 Rest of APAC Spatial Proteomics Market, By Technology, 2022-2030 (USD Million)
142 Rest of APAC Spatial Proteomics Market, By Sample Type, 2022-2030 (USD Million)
143 Rest of APAC Spatial Proteomics Market, By Workflow, 2022-2030 (USD Million)
144 REST OF APAC Spatial Proteomics Market, By END-USE, 2022-2030 (USD Million)
145 Middle East and Africa Spatial Proteomics Market, By Product, 2022-2030 (USD Million)
146 Middle East and Africa Spatial Proteomics Market, By Technology, 2022-2030 (USD Million)
147 Middle East and Africa Spatial Proteomics Market, By Sample Type, 2022-2030 (USD Million)
148 MIDDLE EAST AND AFRICA Spatial Proteomics Market, By Workflow, 2022-2030 (USD Million)
149 MIDDLE EAST AND AFRICA Spatial Proteomics Market, By END-USE, 2022-2030 (USD Million)
150 Middle East and Africa Spatial Proteomics Market, By Country, 2022-2030 (USD Million)
151 Saudi Arabia Spatial Proteomics Market, By Product, 2022-2030 (USD Million)
152 Saudi Arabia Spatial Proteomics Market, By Technology, 2022-2030 (USD Million)
153 Saudi Arabia Spatial Proteomics Market, By Sample Type, 2022-2030 (USD Million)
154 saudi arabia Spatial Proteomics Market, By Workflow, 2022-2030 (USD Million)
155 SAUDI ARABIA Spatial Proteomics Market, By END-USE, 2022-2030 (USD Million)
156 UAE Spatial Proteomics Market, By Product, 2022-2030 (USD Million)
157 UAE Spatial Proteomics Market, By Technology, 2022-2030 (USD Million)
158 UAE Spatial Proteomics Market, By Sample Type, 2022-2030 (USD Million)
159 uae Spatial Proteomics Market, By Workflow, 2022-2030 (USD Million)
160 UAE Spatial Proteomics Market, By END-USE, 2022-2030 (USD Million)
161 ISRAEL Spatial Proteomics Market, By Product, 2022-2030 (USD Million)
162 ISRAEL Spatial Proteomics Market, By Technology, 2022-2030 (USD Million)
163 ISRAEL Spatial Proteomics Market, By Sample Type, 2022-2030 (USD Million)
164 ISRAEL Spatial Proteomics Market, By Workflow, 2022-2030 (USD Million)
165 ISRAEL Spatial Proteomics Market, By END-USE, 2022-2030 (USD Million)
166 South Africa Spatial Proteomics Market, By Product, 2022-2030 (USD Million)
167 South Africa Spatial Proteomics Market, By Technology, 2022-2030 (USD Million)
168 South Africa Spatial Proteomics Market, By Sample Type, 2022-2030 (USD Million)
169 South Africa Spatial Proteomics Market, By Workflow, 2022-2030 (USD Million)
170 SOUTH AFRICA Spatial Proteomics Market, By END-USE, 2022-2030 (USD Million)
171 REST OF MIDDLE EAST AND AFRICA Spatial Proteomics Market, By Product, 2022-2030 (USD Million)
172 REST OF MIDDLE EAST AND AFRICA Spatial Proteomics Market, By Technology, 2022-2030 (USD Million)
173 REST OF MIDDLE EAST AND AFRICA Spatial Proteomics Market, By Sample Type, 2022-2030 (USD Million)
174 REST OF MIDDLE EAST AND AFRICA Spatial Proteomics Market, By Workflow, 2022-2030 (USD Million)
175 REST OF MIDDLE EAST AND AFRICA Spatial Proteomics Market, By END-USE, 2022-2030 (USD Million)
176 Central & South America Spatial Proteomics Market, By Product, 2022-2030 (USD Million)
177 Central & South America Spatial Proteomics Market, By Technology, 2022-2030 (USD Million)
178 Central & South America Spatial Proteomics Market, By Sample Type, 2022-2030 (USD Million)
179 CENTRAL & SOUTH AMERICA Spatial Proteomics Market, By Workflow, 2022-2030 (USD Million)
180 CENTRAL & SOUTH AMERICA Spatial Proteomics Market, By END-USE, 2022-2030 (USD Million)
181 Central & South America Spatial Proteomics Market, By Country, 2022-2030 (USD Million)
182 Brazil Spatial Proteomics Market, By Product, 2022-2030 (USD Million)
183 Brazil Spatial Proteomics Market, By Technology, 2022-2030 (USD Million)
184 Brazil Spatial Proteomics Market, By Sample Type, 2022-2030 (USD Million)
185 brazil Spatial Proteomics Market, By Workflow, 2022-2030 (USD Million)
186 BRAZIL Spatial Proteomics Market, By END-USE, 2022-2030 (USD Million)
187 CHILE Spatial Proteomics Market, By Product, 2022-2030 (USD Million)
188 CHILE Spatial Proteomics Market, By Technology, 2022-2030 (USD Million)
189 CHILE Spatial Proteomics Market, By Sample Type, 2022-2030 (USD Million)
190 CHILE Spatial Proteomics Market, By Workflow, 2022-2030 (USD Million)
191 CHILE Spatial Proteomics Market, By END-USE, 2022-2030 (USD Million)
192 Argentina Spatial Proteomics Market, By Product, 2022-2030 (USD Million)
193 Argentina Spatial Proteomics Market, By Technology, 2022-2030 (USD Million)
194 Argentina Spatial Proteomics Market, By Sample Type, 2022-2030 (USD Million)
195 Argentina Spatial Proteomics Market, By Workflow, 2022-2030 (USD Million)
196 ARGENTINA Spatial Proteomics Market, By END-USE, 2022-2030 (USD Million)
197 REST OF CENTRAL AND SOUTH AMERICA Spatial Proteomics Market, By Product, 2022-2030 (USD Million)
198 REST OF CENTRAL AND SOUTH AMERICA Spatial Proteomics Market, By Technology, 2022-2030 (USD Million)
199 REST OF CENTRAL AND SOUTH AMERICA Spatial Proteomics Market, By Sample Type, 2022-2030 (USD Million)
200 REST OF CENTRAL AND SOUTH AMERICA Spatial Proteomics Market, By Workflow, 2022-2030 (USD Million)
201 REST OF CENTRAL AND SOUTH AMERICA Spatial Proteomics Market, By END-USE, 2022-2030 (USD Million)
202 10X Genomics: PRODUCTS & SERVICES OFFERING
203 Bruker: PRODUCTS & SERVICES OFFERING
204 Fluidigm Corporation: PRODUCTS & SERVICES OFFERING
205 NanoString Technologies, Inc.: PRODUCTS & SERVICES OFFERING
206 Akoya Biosciences, Inc.: PRODUCTS & SERVICES OFFERING
207 PERKINELMER: PRODUCTS & SERVICES OFFERING
208 Danaher: PRODUCTS & SERVICES OFFERING
209 Biotechne: PRODUCTS & SERVICES OFFERING
210 S2 Genomics, Inc., Inc: PRODUCTS & SERVICES OFFERING
211 Seven Bridges Genomics Inc.: PRODUCTS & SERVICES OFFERING
212 Other Companies: PRODUCTS & SERVICES OFFERING
LIST OF FIGURES
1 Global Spatial Proteomics Market Overview
2 Global Spatial Proteomics Market Value From 2022-2030 (USD Mllion)
3 Global Spatial Proteomics Market Share, By Product (2024)
4 Global Spatial Proteomics Market Share, By Technology (2024)
5 Global Spatial Proteomics Market Share, By Sample Type (2024)
6 Global Spatial Proteomics Market Share, By Workflow (2024)
7 Global Spatial Proteomics Market Share, By End-use (2024)
8 Global Spatial Proteomics Market, By Region (Asia Pacific Market)
9 Technological Trends In Global Spatial Proteomics Market
10 Four Quadrant Competitor Positioning Matrix
11 Impact Of Macro & Micro Indicators On The Market
12 Impact Of Key Drivers On The Global Spatial Proteomics Market
13 Impact Of Challenges On The Global Spatial Proteomics Market
14 Porter’s Five Forces Analysis
15 Global Spatial Proteomics Market: By Product Scope Key Takeaways
16 Global Spatial Proteomics Market, By Product Segment: Revenue Growth Analysis
17 Instruments Market, By Region, 2022-2030 (USD Mllion)
18 Consumables Market, By Region, 2022-2030 (USD Mllion)
19 Software Market, By Region, 2022-2030 (USD Mllion)
20 Global Spatial Proteomics Market: By Technology Scope Key Takeaways
21 Global Spatial Proteomics Market, By Technology Segment: Revenue Growth Analysis
22 Imaging-based Technologies Market, By Region, 2022-2030 (USD Mllion)
23 Mass Spectrometry-based Technologies Market, By Region, 2022-2030 (USD Mllion)
24 Sequencing-based Technologies Market, By Region, 2022-2030 (USD Mllion)
25 Others Market, By Region, 2022-2030 (USD Mllion)
26 Global Spatial Proteomics Market: By Sample Type Scope Key Takeaways
27 Global Spatial Proteomics Market, By Sample Type Segment: Revenue Growth Analysis
28 FFPE Market, By Region, 2022-2030 (USD Mllion)
29 Fresh Frozen Market, By Region, 2022-2030 (USD Mllion)
30 Global Spatial Proteomics Market: By Workflow Scope Key Takeaways
31 Global Spatial Proteomics Market, By Workflow Segment: Revenue Growth Analysis
32 Sample Preparation Market, By Region, 2022-2030 (USD Mllion)
33 Instrumental Analysis Market, By Region, 2022-2030 (USD Mllion)
34 Data Analysis Market, By Region, 2022-2030 (USD Mllion)
35 Global Spatial Proteomics Market: By End-use Scope Key Takeaways
36 Global Spatial Proteomics Market, By End-use Segment: Revenue Growth Analysis
37 Academic & Translational Research Institutes Market, By Region, 2022-2030 (USD Mllion)
38 Pharmaceutical and Biotechnology Companies Market, By Region, 2022-2030 (USD Mllion)
39 Others Market, By Region, 2022-2030 (USD Mllion)
40 Regional Analysis, 2022-2030 (USD Mllion)
41 Regional Segment: Revenue Growth Analysis
42 Global Spatial Proteomics Market: Regional Analysis
43 North America Spatial Proteomics Market Overview
44 North America Spatial Proteomics Market, By Product
45 North America Spatial Proteomics Market, By Technology
46 North America Spatial Proteomics Market, By Sample Type
47 North America Spatial Proteomics Market, By Workflow
48 North America Spatial Proteomics Market, By End-use
49 North America Spatial Proteomics Market, By Country
50 U.S. Spatial Proteomics Market, By Product
51 U.S. Spatial Proteomics Market, By Technology
52 U.S. Spatial Proteomics Market, By Sample Type
53 U.S. Spatial Proteomics Market, By Workflow
54 U.S. Spatial Proteomics Market, By End-use
55 Canada Spatial Proteomics Market, By Product
56 Canada Spatial Proteomics Market, By Technology
57 Canada Spatial Proteomics Market, By Sample Type
58 Canada Spatial Proteomics Market, By Workflow
59 Canada Spatial Proteomics Market, By End-use
60 Mexico Spatial Proteomics Market, By Product
61 Mexico Spatial Proteomics Market, By Technology
62 Mexico Spatial Proteomics Market, By Sample Type
63 Mexico Spatial Proteomics Market, By Workflow
64 Mexico Spatial Proteomics Market, By End-use
65 Four Quadrant Positioning Matrix
66 Company Market Share Analysis
67 10X Genomics: Company Snapshot
68 10X Genomics: SWOT Analysis
69 10X Genomics: Geographic Presence
70 Bruker: Company Snapshot
71 Bruker: SWOT Analysis
72 Bruker: Geographic Presence
73 Fluidigm Corporation: Company Snapshot
74 Fluidigm Corporation: SWOT Analysis
75 Fluidigm Corporation: Geographic Presence
76 NanoString Technologies, Inc.: Company Snapshot
77 NanoString Technologies, Inc.: Swot Analysis
78 NanoString Technologies, Inc.: Geographic Presence
79 Akoya Biosciences, Inc.: Company Snapshot
80 Akoya Biosciences, Inc.: SWOT Analysis
81 Akoya Biosciences, Inc.: Geographic Presence
82 PERKINELMER: Company Snapshot
83 PERKINELMER: SWOT Analysis
84 PERKINELMER: Geographic Presence
85 Danaher : Company Snapshot
86 Danaher : SWOT Analysis
87 Danaher : Geographic Presence
88 Biotechne: Company Snapshot
89 Biotechne: SWOT Analysis
90 Biotechne: Geographic Presence
91 S2 Genomics, Inc., Inc.: Company Snapshot
92 S2 Genomics, Inc., Inc.: SWOT Analysis
93 S2 Genomics, Inc., Inc.: Geographic Presence
94 Seven Bridges Genomics Inc.: Company Snapshot
95 Seven Bridges Genomics Inc.: SWOT Analysis
96 Seven Bridges Genomics Inc.: Geographic Presence
97 Other Companies: Company Snapshot
98 Other Companies: SWOT Analysis
99 Other Companies: Geographic Presence
The Global Spatial Proteomics Market has been studied from the year 2019 till 2030. However, the CAGR provided in the report is from the year 2025 to 2030. The research methodology involved three stages: Desk research, Primary research, and Analysis & Output from the entire research process.

The desk research involved a robust background study which meant referring to paid and unpaid databases to understand the market dynamics; mapping contracts from press releases; identifying the key players in the market, studying their product portfolio, competition level, annual reports/SEC filings & investor presentations; and learning the demand and supply-side analysis for the Spatial Proteomics Market.

The primary research activity included telephonic conversations with more than 50 tier 1 industry consultants, distributors, and end-use product manufacturers.

Finally, based on the above thorough research process, an in-depth analysis was carried out considering the following aspects: market attractiveness, current & future market trends, market share analysis, SWOT analysis of the company and customer analytics.

Frequently Asked Questions

This FREE sample includes market data points, ranging from trend analyses to market estimates & forecasts. See for yourself.
Or view our licence options:
Tailor made solutions just for you
80% of our clients seek made-to-order reports. How do you want us to tailor yours?
OUR CLIENTS


